
PS/EARTH SCIENCE
The University of the State of New York
REGENTS HIGH SCHOOL EXAMINATION
PHYSICAL SETTING
EARTH SCIENCE
Wednesday, August 13, 2008 — 12:30 to 3:30 p.m., only
This is a test of your knowledge of Earth science. Use that knowledge to answer
all questions in this examination. Some questions may require the use of the Earth
Science Reference Tables. The Earth Science Reference Tables are supplied separately.
Be certain you have a copy of the 2001 Edition (Revised November 2006) of these
reference tables before you begin the examination.
Your answer sheet for Part A and Part B–1 is the last page of this examination
booklet. Turn to the last page and fold it along the perforations. Then, slowly and
carefully, tear off your answer sheet and fill in the heading.
The answers to the questions in Part B–2 and Part C are to be written in your
separate answer booklet. Be sure to fill in the heading on the front of your answer
booklet.
You are to answer all questions in all parts of this examination according to the
directions provided in the examination booklet. Record your answers to the Part A
and Part B–1 multiple-choice questions on your separate answer sheet. Write your
answers to the Part B–2 and Part C questions in your answer booklet. All work should
be written in pen, except for graphs and drawings, which should be done in pencil.
You may use scrap paper to work out the answers to the questions, but be sure to
record all your answers on your separate answer sheet and in your answer booklet.
When you have completed the examination, you must sign the statement printed
at the end of your separate answer sheet, indicating that you had no unlawful
knowledge of the questions or answers prior to the examination and that you have
neither given nor received assistance in answering any of the questions during the
examination. Your answer sheet and answer booklet cannot be accepted if you fail to
sign this declaration.
Notice. . .
A four-function or scientific calculator and a copy of the 2001 Earth Science Reference Tables
(Revised November 2006) must be available for you to use while taking this examination.
The use of any communications device is strictly prohibited when taking this
examination. If you use any communications device, no matter how briefly, your
examination will be invalidated and no score will be calculated for you.
DO NOT OPEN THIS EXAMINATION BOOKLET UNTIL THE SIGNAL IS GIVEN.
E C N E I C S H T R A E / S P
Part A
Answer all questions in this part.
Directions (1–35): For each statement or question, write on your separate answer sheet the number of the
word or expression that, of those given, best completes the statement or answers the question. Some questions
may require the use of the Earth Science Reference Tables .
1 Which statement best describes the age of our
7 The spinning of Earth on its axis causes the
solar system and the universe?
apparent rising and setting of the
(1) The universe is at least twice as old as our
(1) Sun, only
solar system.
(2) Sun and the Moon, only
(2) Our solar system is at least twice as old as the
(3) Moon and some stars, only
universe.
(4) Sun, the Moon, and some stars
(3) Our solar system and the universe are esti-
mated to be 5 billion years old.
(4) Our solar system and the universe are esti-
8 On sunny summer days, a breeze often develops
mated to be 10 billion years old.
that blows from large bodies of water toward
nearby landmasses because the
(1) temperature of the air above the landmasses
2 A Foucault pendulum is used to prove that
is greater
(1) the Sun rotates on its axis
(2) specific heat of the landmasses is greater
(2) the Sun revolves around Earth
(3) temperatures of the bodies of water are
(3) Earth rotates on its axis
greater
(4) Earth revolves around the Sun
(4) air over the bodies of water becomes heavier
with additional water vapor
3 Compared to the terrestrial planets, the Jovian
planets are
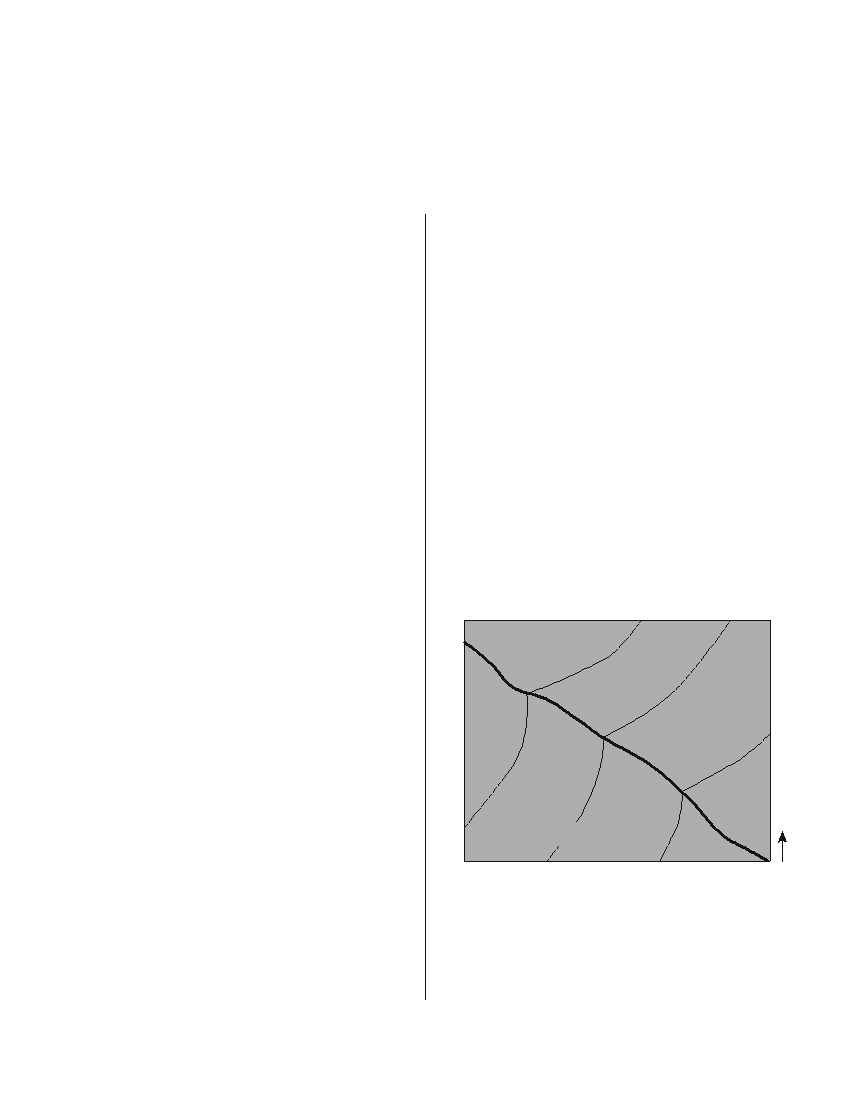
9 The topographic map below shows part of a
(1) smaller and have lower densities
stream.
(2) smaller and have greater densities
(3) larger and have lower densities
(4) larger and have greater densities
4 Which process produces the energy that allows
H a m
the stars of the universe to radiate visible light?
m
e r
(1) convection
(3) insolation
S t r e
a
(2) nuclear fusion
(4) radioactive decay
m
5 A soil sample with a large amount of space
between the particles will have a
N
(1) low permeability rate (3) high porosity
200
(2) low infiltration rate
(4) high capillarity
In which general direction is the stream flowing?
6 When Earth cools, most of the energy transferred
(1) northeast
(3) southeast
from Earth’s surface to space is transferred by the
(2) northwest
(4) southwest
process of
(1) conduction
(3) refraction
(2) reflection
(4) radiation
P.S./E. Sci.–Aug. ’08
[2]
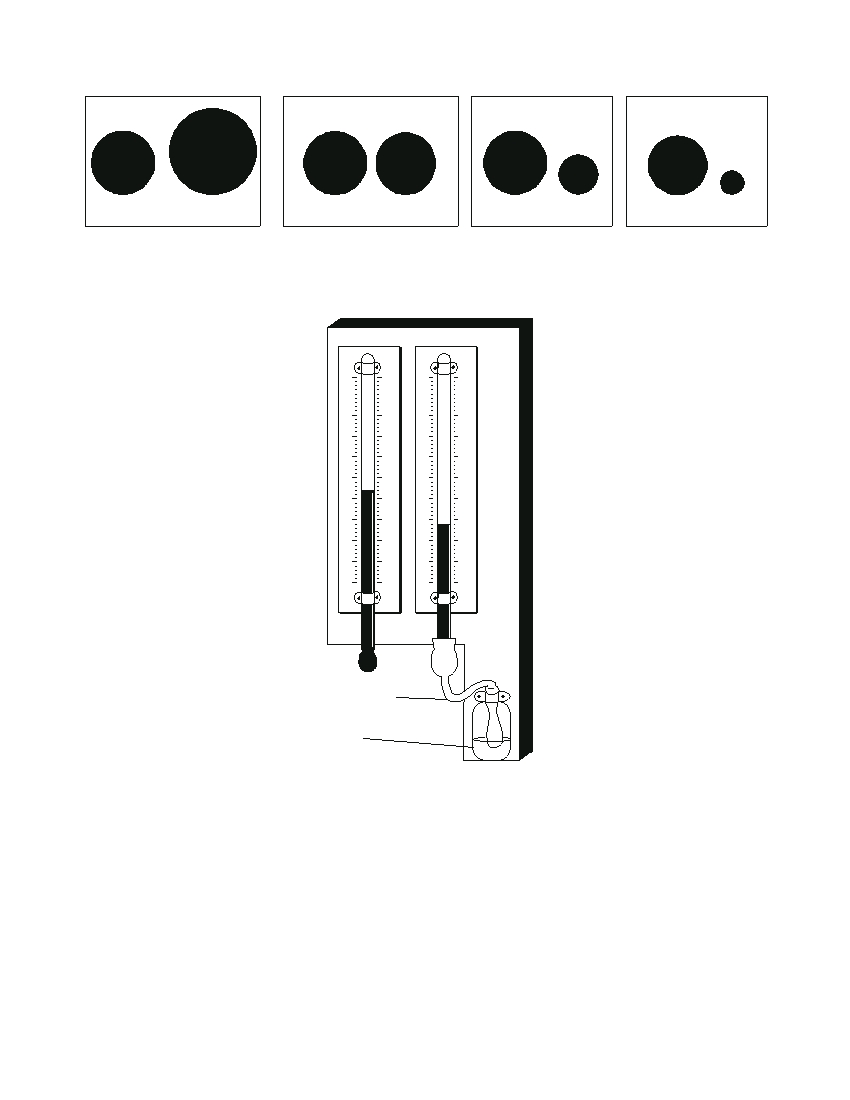
10 Which pair of shaded circles best represents the relative sizes of Earth and Venus when drawn to scale?
Earth
Venus
Earth
Venus
Earth
Venus
Earth
Venus
( 1 )
( 2 )
( 3 )
( 4 )
11 The weather instrument below is used to determine dewpoint and relative humidity.
° C
° C
50
50
40
40
30
30
20
20
10
10
0
0
Wet cloth wick
Reservoir
of water
Based on the temperatures shown, the approximate dewpoint and relative humidity
are
(1) –19°C and 4%
(3) 8°C and 40%
(2) –5°C and 25%
(4) 12°C and 53%
P.S./E. Sci.–Aug. ’08
[3]
[OVER]
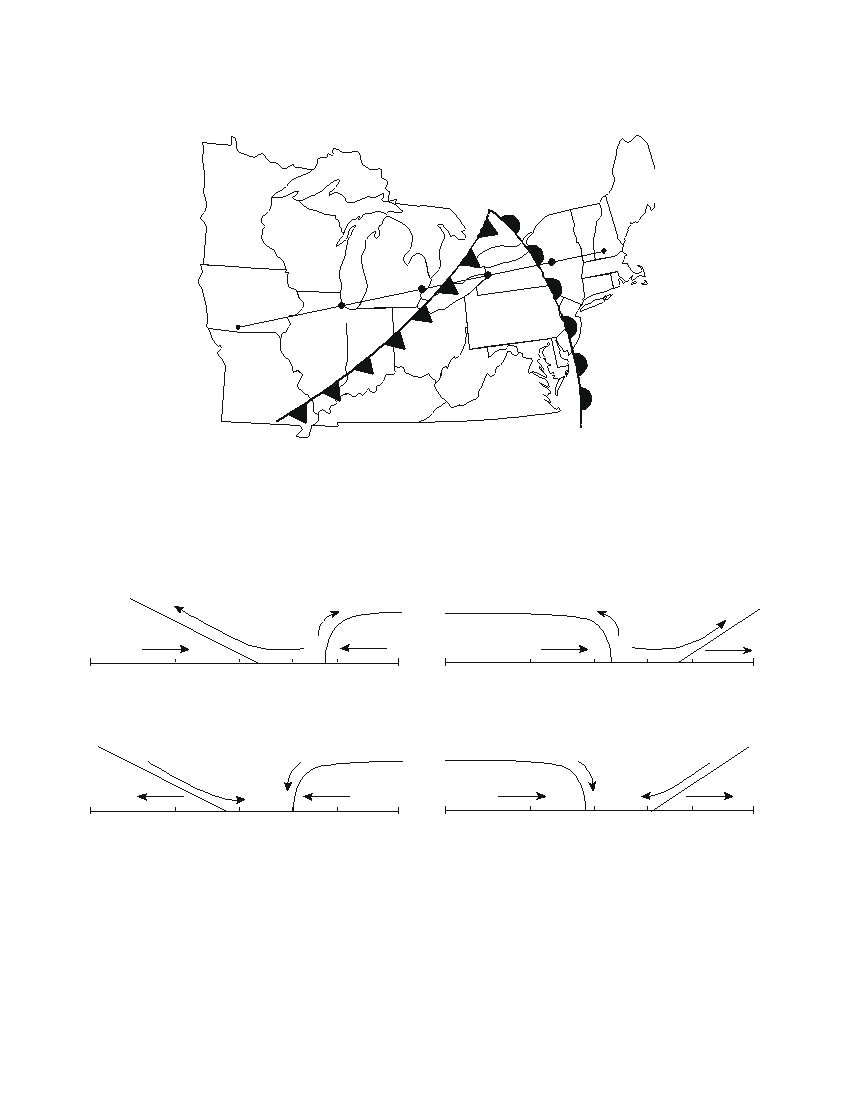
Base your answers to questions 12 through 14 on the weather map below, which shows a high-pressure
center ( H ) and a low-pressure center ( L ), with two fronts extending from the low-pressure center. Points X and
Y are locations on the map connected by a reference line.
H
L
Utica
Y
Detroit
Buffalo
X
Chicago
12 Which type of front is located between Buffalo and Detroit?
(1) stationary
(3) occluded
(2) warm
(4) cold
13 Which cross section best represents the fronts and air movements in the lower
atmosphere along line XY ?
X
Chicago
Detroit
Buffalo Utica
Y
X
Chicago
Detroit
Buffalo Utica
Y
( 1 )
( 3 )
X
Chicago
Detroit
Buffalo Utica
Y
X
Chicago
Detroit
Buffalo Utica
Y
( 2 )
( 4 )
P.S./E. Sci.–Aug. ’08
[4]
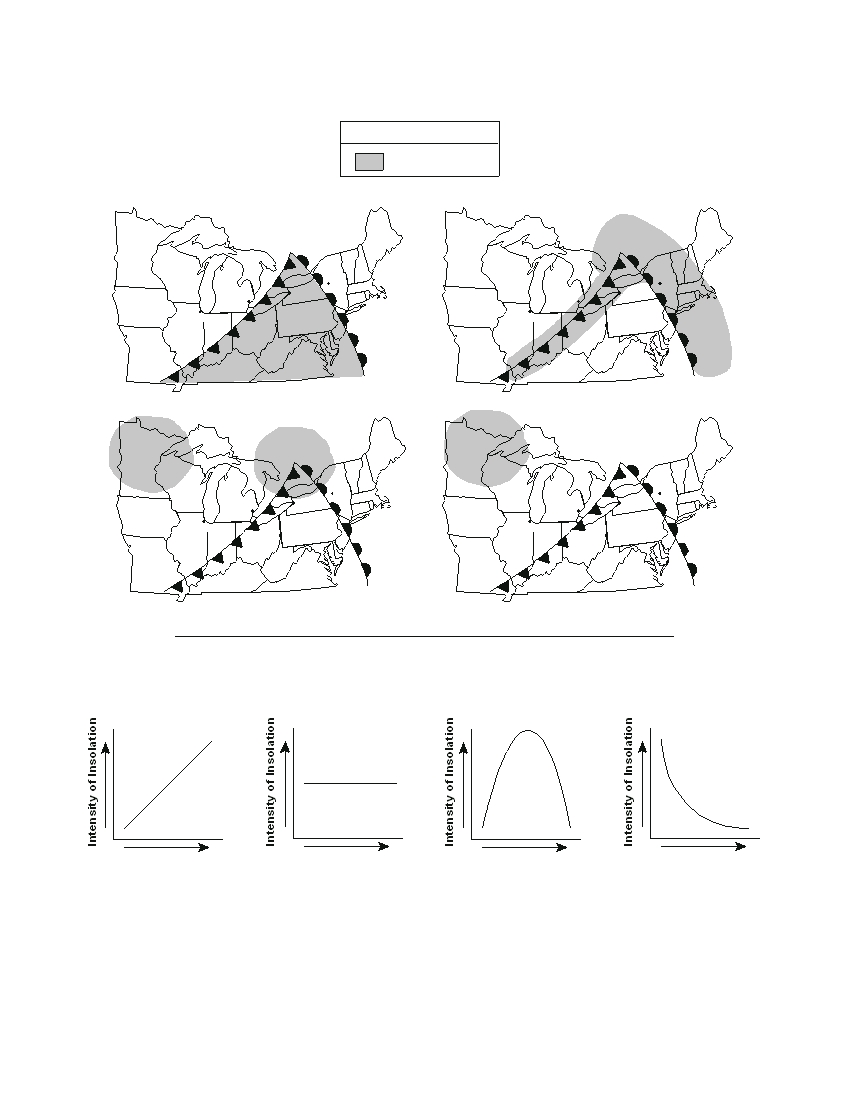
14 Which map best shows the most probable areas of precipitation associated with these
weather systems?
Key
Precipitation
H
L
H
L
Utica
Utica
Utica
Detroit
Buffalo
Detroit
Buffalo
Chicago
Chicago
( 1 )
( 3 )
H
L
H
L
Utica
Utica
Detroit
Buffalo
Detroit
Buffalo
Chicago
Chicago
( 2 )
( 4 )
15 Which graph best shows the general relationship between the altitude of the noontime Sun and the
intensity of insolation received at a location?
Noontime
Noontime
Noontime
Noontime
Altitude of the Sun
Altitude of the Sun
Altitude of the Sun
Altitude of the Sun
( 1 )
( 2 )
( 3 )
( 4 )
P.S./E. Sci.–Aug. ’08
[5]
[OVER]
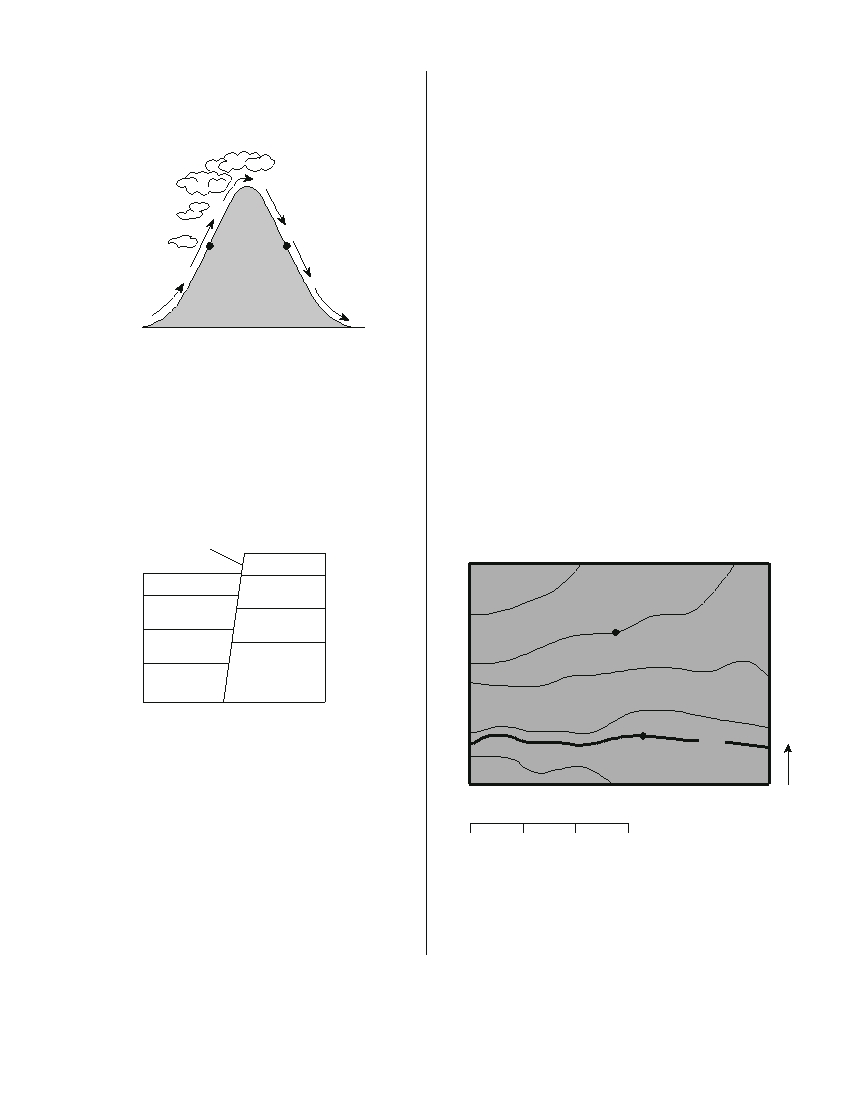
16 The cross section below shows the direction of air
19 What happens to the density and temperature of
flowing over a mountain. Points A and B are at
rock within Earth’s interior as depth increases?
the same elevation on opposite sides of the
(1) density decreases and temperature decreases
mountain.
(2) density decreases and temperature increases
(3) density increases and temperature increases
(4) density increases and temperature decreases
20 Scientists believe that a large asteroid struck
Earth approximately 65 million years ago. It is
A
B
often theorized that this event contributed to the
(1) end of the last ice age
(2) breaking up of the supercontinent Pangea
(3) evolution of the first birds
(4) extinction of the dinosaurs
Compared to the air temperature and humidity at
point A , the air temperature and humidity at
21 Which two landscape regions in New York State
point B are usually
have the oldest surface bedrock?
(1) cooler and drier
(3) warmer and drier
(1) Allegheny Plateau and Newark Lowlands
(2) cooler and wetter
(4) warmer and wetter
(2) Tug Hill Plateau and Erie-Ontario Lowlands
(3) Taconic Mountains and the Catskills
17 The cross section below shows rock layers A, B,
(4) Adirondack Mountains and Hudson Highlands
C, D, and fault F . The rock layers have not been
overturned.
22 The topographic map below shows locations X
F
and Y .
A
A
B
B
X
C
C
D
D
Which sequence places the rock layers and fault
N
in order from oldest to youngest?
Y
500
(1) D → C → B → A → F
(2) A → B → C → D → F
(3) F → D → C → B → A
Scale of Miles
Contour interval: 20 feet
(4) F → A → B → C → D
0
1
2
3
18 The largest sediment particles that can be trans-
ported by a stream traveling at a velocity of
What is the approximate gradient between X
and Y ?
200 centimeters per second are
(1) 15 ft/mi
(3) 30 ft/mi
(1) boulders
(3) pebbles
(2) 20 ft/mi
(4) 60 ft/mi
(2) cobbles
(4) sand
P.S./E. Sci.–Aug. ’08
[6]
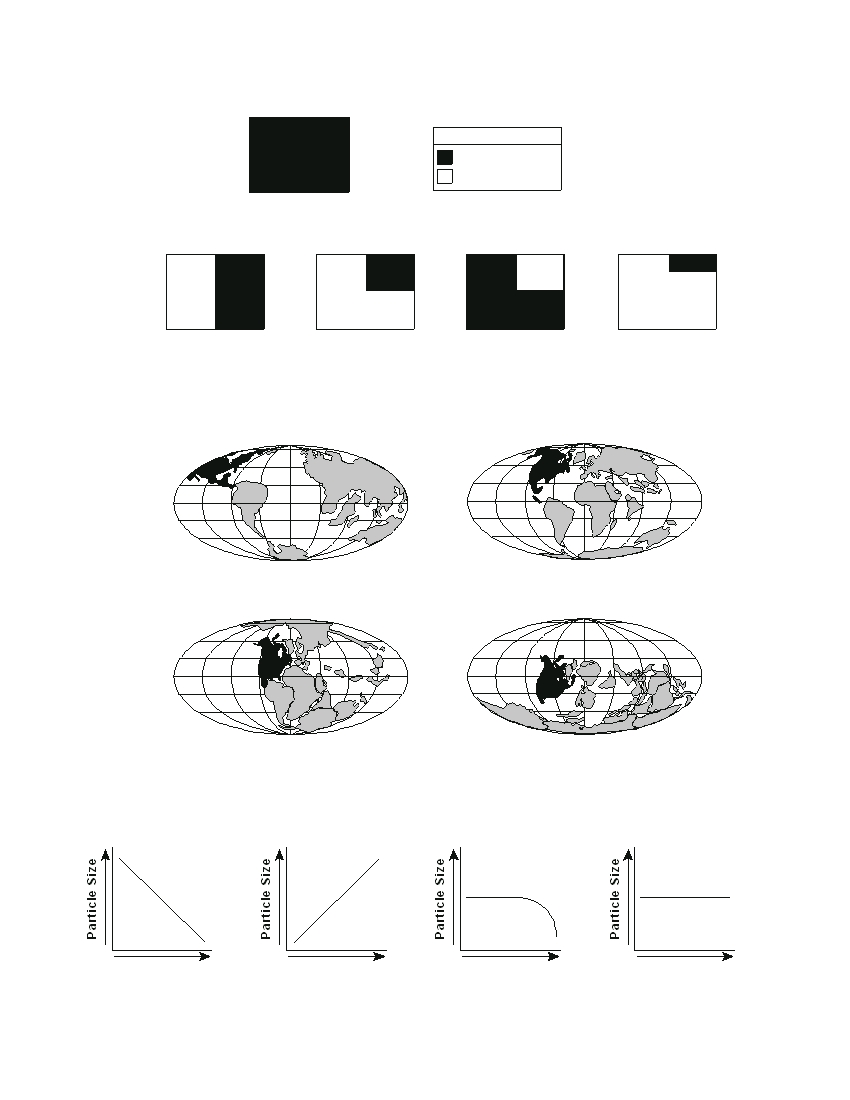
23 The diagram below represents a sample of a radioactive isotope.
Sample before decay
Key
Radioactive isotope
Decay product
Which diagram best represents the percentage of this radioactive isotope sample that
will remain after 2 half-lives?
( 1 )
( 2 )
( 3 )
( 4 )
24 Which map best indicates the probable locations of continents 100 million years from now if tectonic plate
movement continues at its present rate and direction?
( 1 )
( 3 )
( 2 )
( 4 )
25 Which graph best represents the relationship between the slope of a river and the particle size that can be
transported by that river?
Slope
Slope
Slope
Slope
( 1 )
( 2 )
( 3 )
( 4 )
P.S./E. Sci.–Aug. ’08
[7]
[OVER]
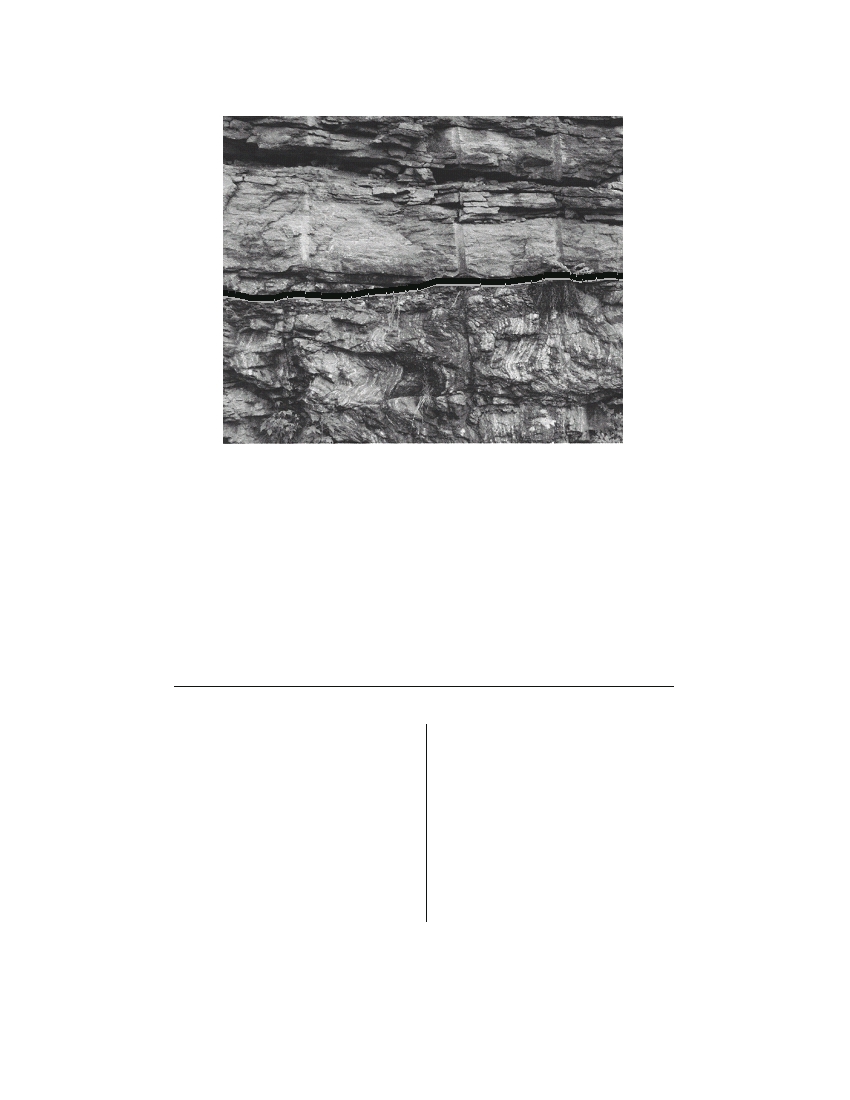
Base your answers to questions 26 and 27 on the photograph below, which shows a bedrock outcrop in
northeastern New York State. Line AB is an unconformity between sandstone C and metamorphic rock D .
C
B
A
D
26 The lower layers of sediment found in sandstone C were deposited 520 million years
ago. During which period of geologic time did this deposition occur?
(1) Cambrian
(3) Silurian
(2) Ordovician
(4) Triassic
27 After the metamorphism of rock D , which sequence of events most probably formed
unconformity AB ?
(1) flooding → deposition → erosion → uplift
(2) uplift → erosion → flooding → deposition
(3) deposition → flooding → uplift → erosion
(4) erosion → flooding → uplift → deposition
28 Which agent of erosion was primarily responsible
29 Which observation about the Mid-Atlantic Ridge
for forming the long, narrow, U-shaped valleys in
region provides the best evidence that the
the Finger Lakes region of New York State?
seafloor has been spreading for millions of years?
(1) wind
(1) The bedrock of the ridge and nearby seafloor
(2) landslides
is igneous rock.
(3) meandering streams
(2) The ridge is the location of irregular volcanic
(4) continental glaciers
eruptions.
(3) Several faults cut across the ridge and nearby
seafloor.
(4) Seafloor bedrock is younger near the ridge
and older farther away.
P.S./E. Sci.–Aug. ’08
[8]
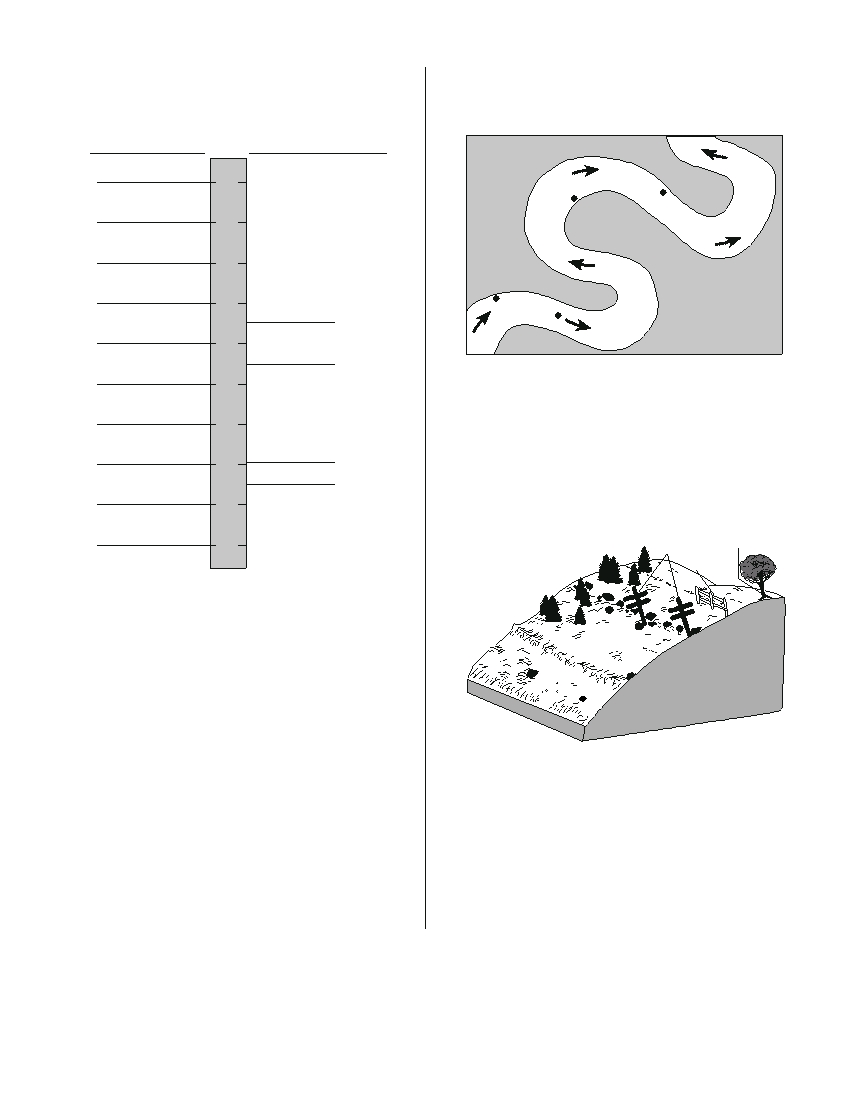
30 The diagram below shows the index minerals of
32 The map below shows a meandering stream.
Mohs hardness scale compared with the hardness
Points A, B, C, and D represent locations along
of some common objects.
the stream bottom.
Index Minerals
Common Objects
Diamond
10
D
Corundum
9
C
Topaz
8
Quartz
A
7
Steel file
B
Orthoclase
6
Glass
Apatite
5
At which location is the greatest amount of
sediment most likely being deposited?
Fluorite
4
(1) A
(3) C
(2) B
(4) D
Calcite
Copper penny
3
Fingernail
33 The diagram below shows the surface features of
Gypsum
2
a landscape.
Talc
Leaning
Curving growth
1
poles
pattern
Leaning
fence
Which statement is best supported by the
diagram?
(1) A fingernail will scratch calcite but not
gypsum.
(2) Calcite will be scratched by a copper penny.
(3) The mineral apatite will scratch topaz.
(4) A steel file has a hardness of about 7.5.
31 The planetary wind belts in the troposphere are
primarily caused by the
Based on the features shown, which erosional
(1) Earth’s rotation and unequal heating of
agent had the greatest effect on tree growth and
Earth’s surface
the structures that humans have built on this
(2) Earth’s revolution and unequal heating of
landscape?
Earth’s surface
(1) running water
(3) prevailing wind
(3) Earth’s rotation and Sun’s gravitational attrac-
(2) moving ice
(4) mass movement
tion on Earth’s atmosphere
(4) Earth’s revolution and Sun’s gravitational
attraction on Earth’s atmosphere
P.S./E. Sci.–Aug. ’08
[9]
[OVER]
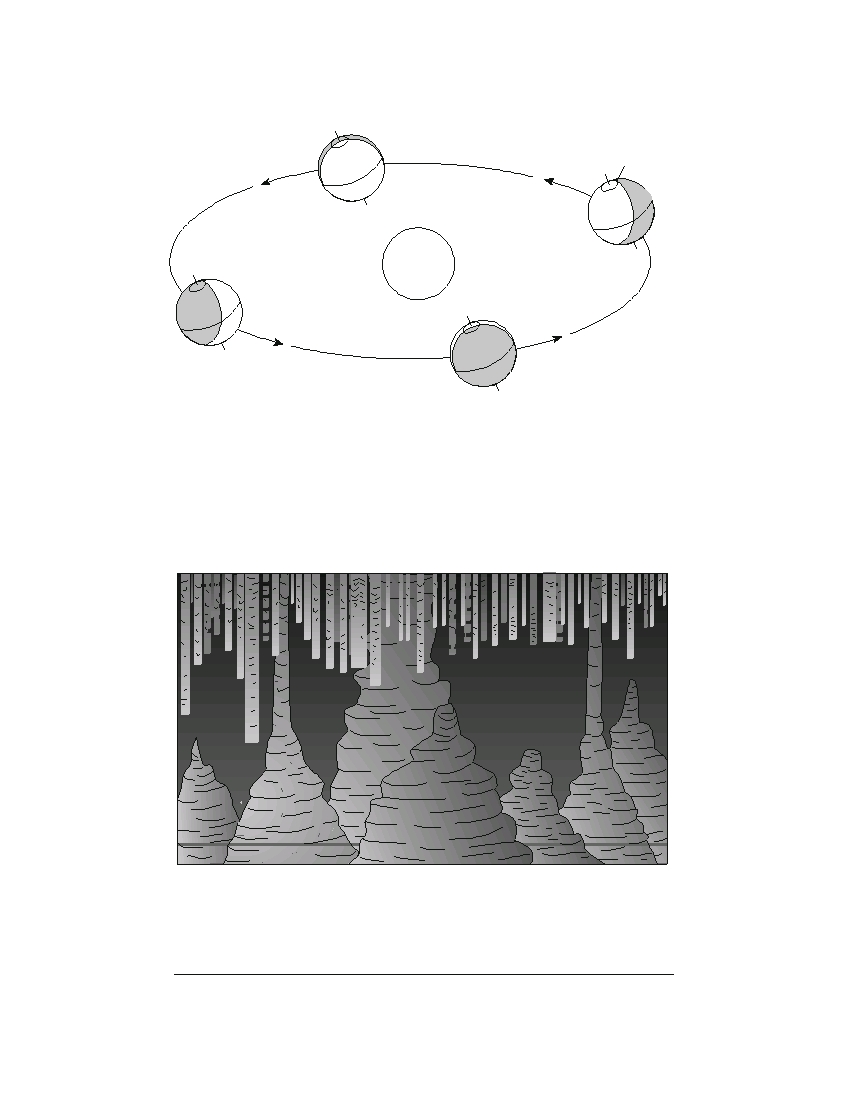
34 The diagram below shows Earth’s orbit around the Sun. Locations A, B, C, and D represent Earth on the
first day of each season.
N
C
r
Arctic Circle
E q u
a
t o
N
Night
Day
B
N
Sun
Day
Night
N
D
A
(Not drawn to scale)
Which location represents March 21?
(1) A
(3) C
(2) B
(4) D
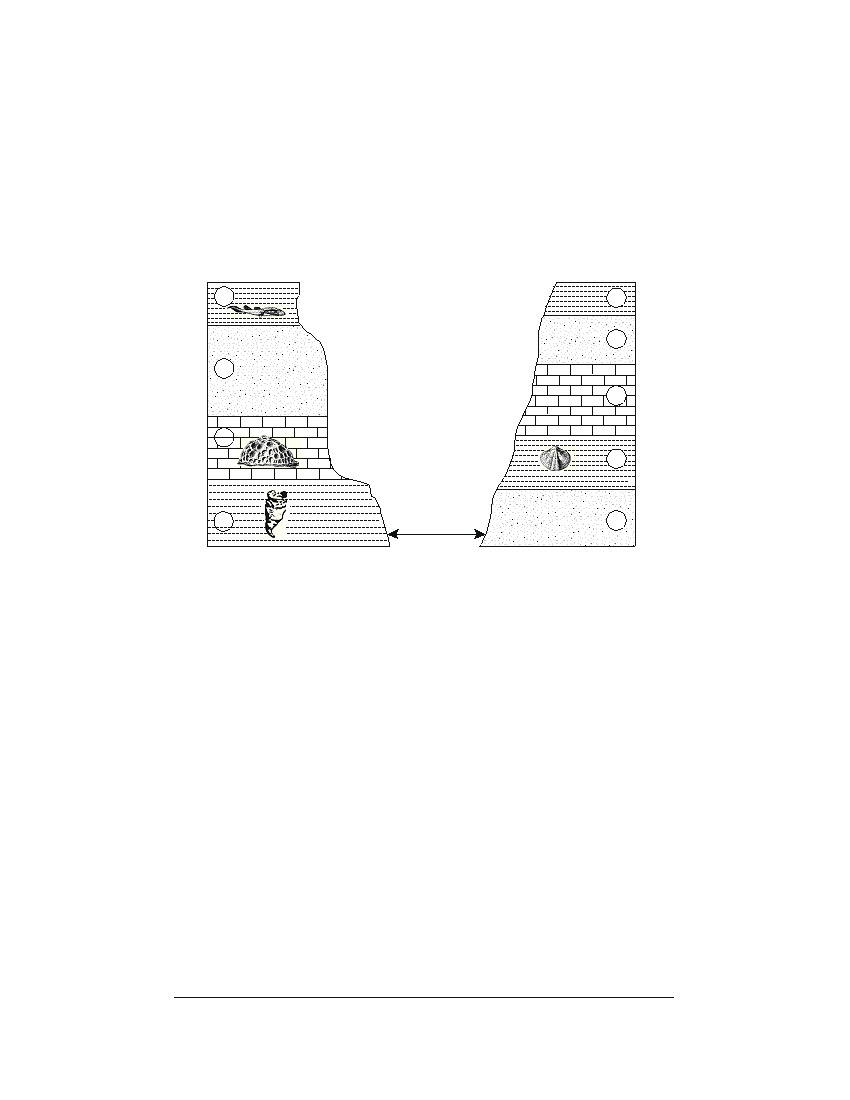
35 The diagram below shows some features in a cave.
Which type of rock was chemically weathered by acidic groundwater to produce the
cave and its features?
(1) siltstone
(3) quartzite
(2) basalt
(4) limestone
P.S./E. Sci.–Aug. ’08
[10]
Part B–1
Answer all questions in this part.
Directions (36–50): For each statement or question, write on your separate answer sheet the number of the
word or expression that, of those given, best completes the statement or answers the question. Some questions
may require the use of the Earth Science Reference Tables.
Base your answers to questions 36 through 38 on the cross sections below, which represent two bedrock out-
crops 15 kilometers apart. The rock layers have been numbered for identification and some contain the index
fossil remains shown.
1
5
6
2
7
3
8
4
15 km
9
Outcrop 1
Outcrop 2
(Not drawn to scale)
36 When these rocks were deposited as sediments, this area was most likely
(1) under the ocean
(2) a desert between high mountains
(3) repeatedly covered by lava flows
(4) glaciated several times
37 Both organisms that formed the fossils found in rock layers 3 and 4
(1) lived during the same period of geologic time
(2) lived in polar regions
(3) are members of the same group of organisms
(4) are still alive today
38 Evidence best indicates that rock layers 4 and 8 were deposited during the same
geologic period because both layers
(1) contain the same index fossil
(2) are composed of glacial sediments
(3) contain index fossils of the same age
(4) are found in the same area
P.S./E. Sci.–Aug. ’08
[11]
[OVER]
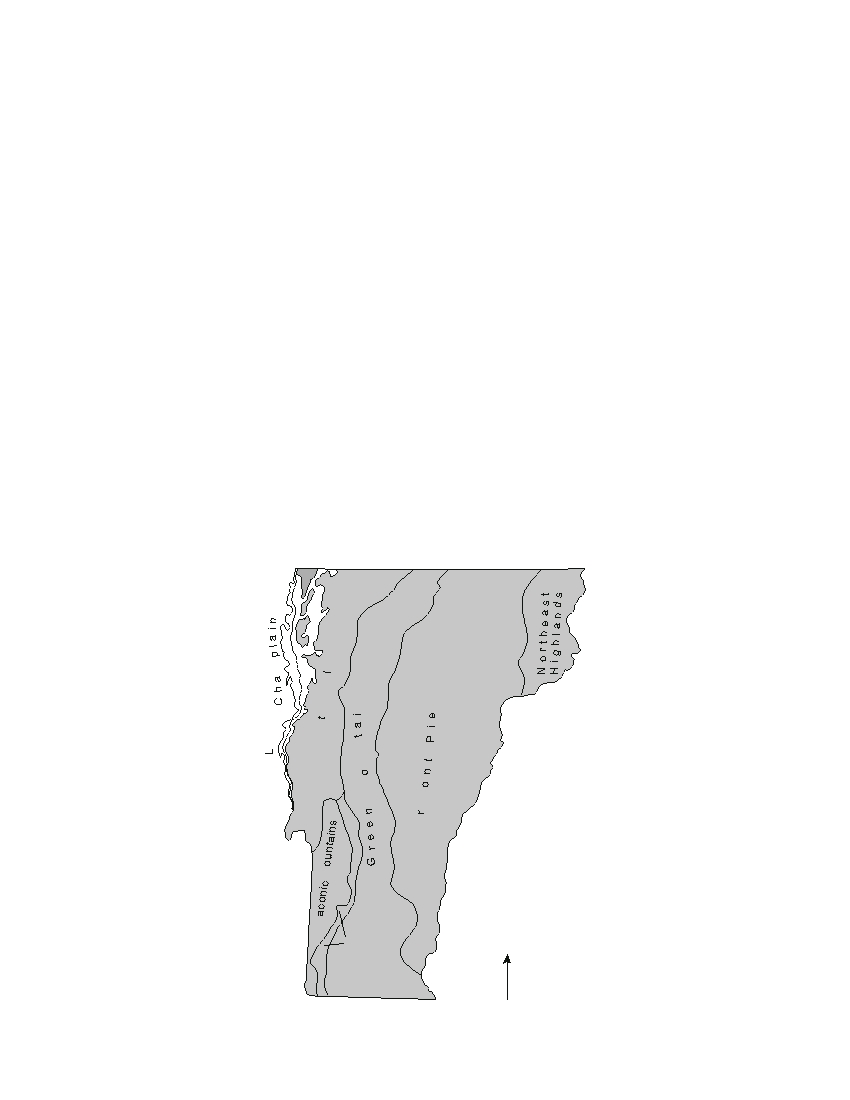
Base your answers to questions 39 through 43 on the passage and map below. The map shows the
generalized landscape regions of Vermont.
Landscape Regions of Vermont
Most of Vermont’s landscape regions consist of ancient, weathered mountains that
were covered by several ice sheets during the last ice age. When the ice melted, sand,
cobbles, and boulders were deposited throughout the state. Vermont is divided into six
landscape regions.
(1) The Vermont Lowlands region has a mild climate, with Lake Champlain mod-
erating its temperature.
(2) The Green Mountains run the length of Vermont and were formed over
400 million years ago. Most of the bedrock is metamorphic and the region is
known for its deposits of talc and asbestos.
(3) The Taconic Mountains extend into New York State. Slate and marble are
commonly mined in this region.
(4) The Valley of Vermont is a narrow valley between two mountain ranges. Most
of the bedrock in the region is limestone and marble.
(5) The Vermont Piedmont covers the largest area of the state. This region
consists of rolling hills and valleys. Granite mining is an important industry.
(6) The Northeast Highlands is a mountainous region composed of granite
bedrock.
Generalized Landscape Regions of Vermont
m
t
n
o
s
m
n
d
e
k
a
n
u
ermonLowands
V
M
m
e
V
T
M
Valley of
N
Vermont
P.S./E. Sci.–Aug. ’08
[12]

39 The classification of landscape regions is primarily
42 Some of the bedrock in the Green Mountains is
based on which factors?
actually green in color because of the presence of
(1) climate, vegetation, and surface features
the mineral chlorite. Which other mineral can
(2) bedrock type, structure, and elevation
cause rocks to appear green?
(3) state boundaries, streams, and rivers
(1) sulfur
(3) olivine
(4) nearness to mountains, lakes, and oceans
(2) magnetite
(4) halite
40 Which Vermont landscape region is a continua-
43 Which processes formed the granite that is mined
tion of New York State’s Champlain Lowlands
in Vermont?
landscape?
(1) compaction and cementation of sediments
(1) Vermont Lowlands
(2) cooling and solidification of magma
(2) Valley of Vermont
(3) uplift and weathering of bedrock
(3) Taconic Mountains
(4) application of heat and pressure to shale
(4) Green Mountains
41 During which geologic period did a major
orogeny form the Taconic Mountains?
(1) Cretaceous
(3) Devonian
(2) Permian
(4) Ordovician
P.S./E. Sci.–Aug. ’08
[13]
[OVER]
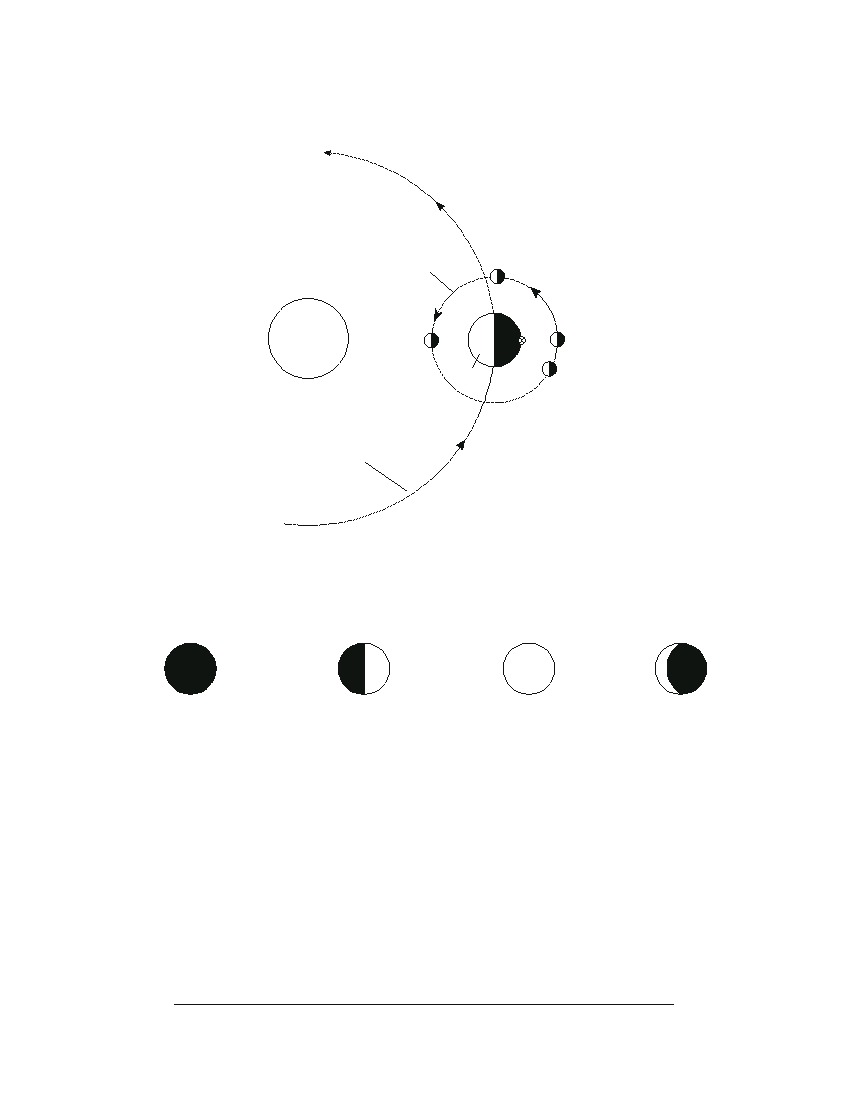
Base your answers to questions 44 through 46 on the diagram below, which shows Earth in orbit around
the Sun, and the Moon in orbit around Earth. M 1 , M 2 , M 3 , and M 4 indicate positions of the Moon in its orbit.
Letter A indicates a location on Earth’s surface.
Moon’s
orbit
M 4
Sun
M 1
A
M 3
Earth
M 2
Earth’s orbit
(Not drawn to scale)
44 An observer at location A on Earth views the Moon when it is at position M 3 . Which
phase of the Moon will the observer see?
( 1 )
( 2 )
( 3 )
( 4 )
45 At which Moon position could a solar eclipse be seen from Earth?
(1) M 1
(3) M 3
(2) M 2
(4) M 4
46 An observer at location A noticed that the apparent size of the Moon varied slightly
from month to month when the Moon was at position M 4
in its orbit. Which
statement best explains this variation in the apparent size of the Moon?
(1) The Moon expands in summer and contracts in winter.
(2) The Moon shows complete cycles of phases throughout the year.
(3) The Moon’s period of rotation is equal to its period of revolution.
(4) The Moon’s distance from Earth varies in a cyclic manner.
P.S./E. Sci.–Aug. ’08
[14]
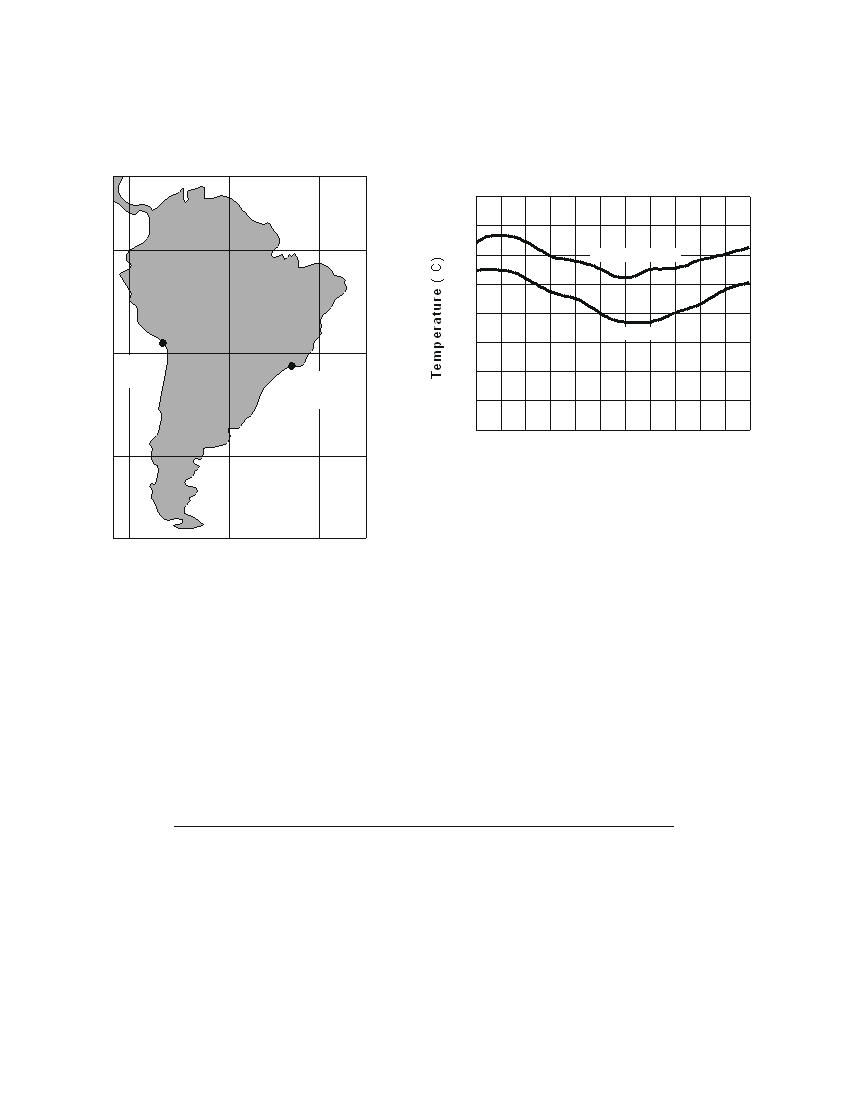
Base your answers to questions 47 and 48 on the map and graph below. The map shows two cities, Arica
and Rio de Janeiro, located on opposite coasts of South America. Both cities are near sea level. The graph
shows the average monthly temperatures for the cities.
South America
Average Monthly Temperatures
of Rio de Janeiro and Arica
32
28
0
24
Rio de Janeiro
20
16
Arica
12
Arica
Pacific
20 S
Ocean
8
Rio de
Janeiro
4
0
J
F
M
A
M
J
J
A
S
O
N
D
40 S
Month
Atlantic
Ocean
80 W
60 W
40 W
47 Why does Arica have cooler average monthly temperatures than Rio de Janeiro?
(1) Rio de Janeiro receives insolation at a higher angle than Arica.
(2) Rio de Janeiro is influenced by a warmer ocean current than Arica.
(3) Arica is farther north than Rio de Janeiro.
(4) Arica receives yearly insolation that is less intense than Rio de Janeiro.
48 The summer season at Arica and Rio de Janeiro occurs from approximately
(1) March 21 through June 20
(2) June 21 through September 22
(3) September 23 through December 20
(4) December 21 through March 20
P.S./E. Sci.–Aug. ’08
[15]
[OVER]
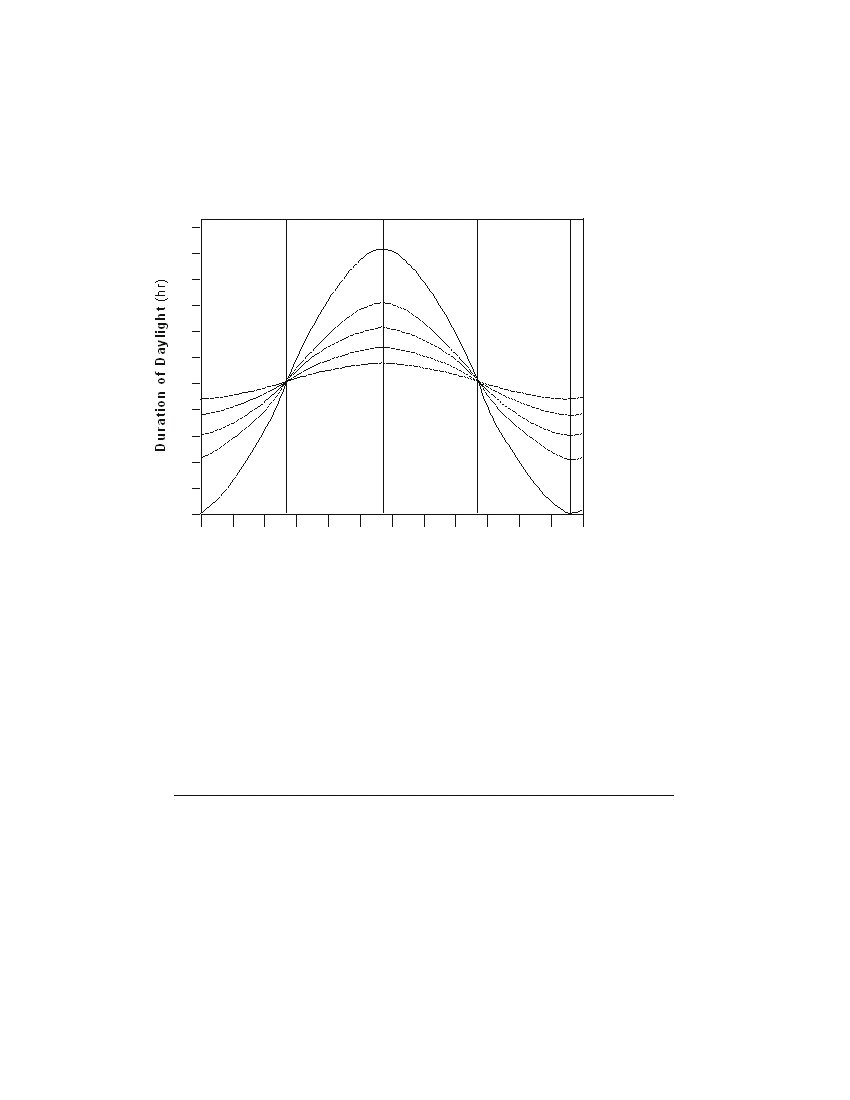
Base your answers to questions 49 and 50 on the graph below, which shows the duration of daylight hours
throughout the year for five cities located in the Northern Hemisphere.
Duration of Daylight Hours
Throughout the Year at Various Locations
Spring
Summer
Fall
Winter
equinox
solstice
equinox
solstice
March 21
June 21
September 23
December 21
18
17
16
15
14
13
12
Caracas 11 N
11
Mexico City 19 N
10
New Orleans 30 N
Denver 40 N
9
8
Edmonton 54 N
7
J
F
M
A
M
J
J
A
S
O
N
D
Months
49 Which city experiences the greatest variation in daylight hours during one year?
(1) Caracas
(3) New Orleans
(2) Mexico City
(4) Edmonton
50 What is the primary reason each city’s duration of daylight hours changes throughout
the year?
(1) Earth’s axis is tilted 23.5° to the plane of its orbit.
(2) Earth’s rotation rate is 15° per day.
(3) The cities are located at different longitudes.
(4) The cities are located at different elevations.
P.S./E. Sci.–Aug. ’08
[16]
Part B–2
Answer all questions in this part.
Directions (51–65): Record your answers in the spaces provided in your answer booklet. Some questions
may require the use of the Earth Science Reference Tables.
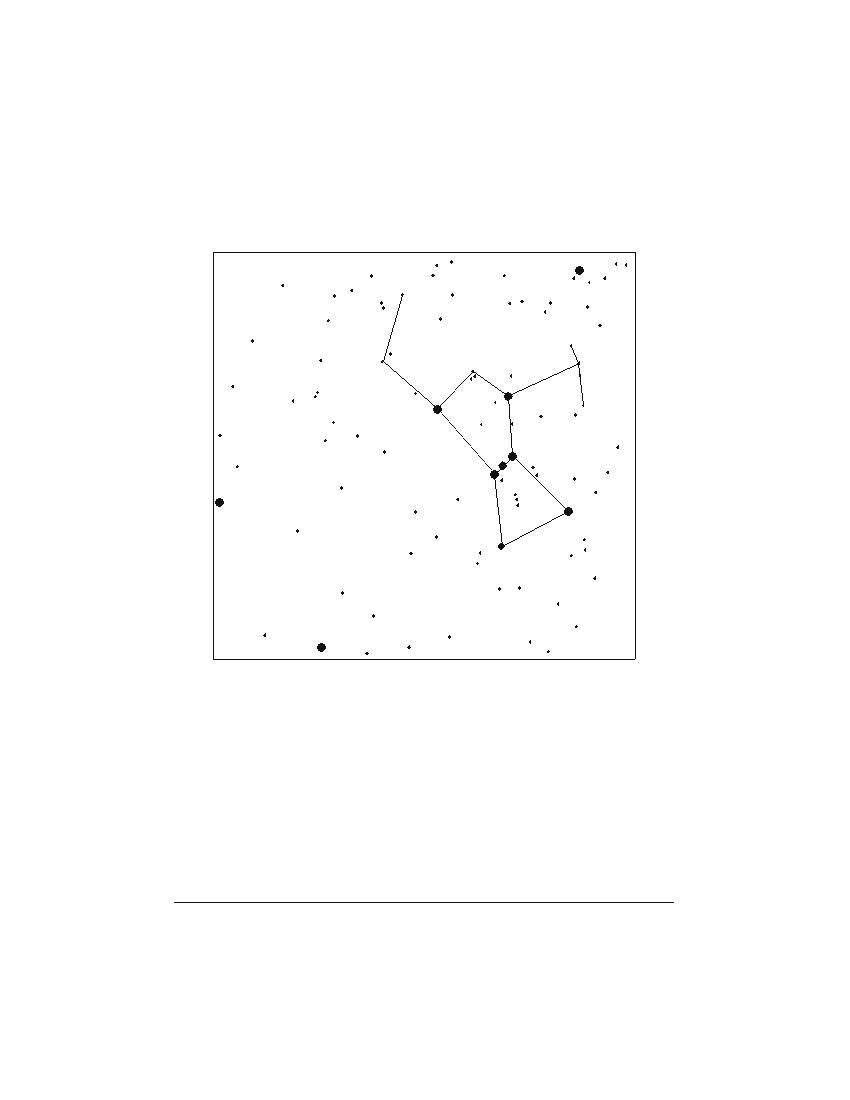
Base your answers to questions 51 through 53 on the star chart below, which shows part of the winter sky
visible from New York State. Some of the brighter stars are labeled and the constellation Orion is outlined.
Aldebaran
Betelgeuse
Bellatrix
Procyon B
Rigel
Sirius
51 Identify the color of the star Bellatrix, which has a surface temperature of
approximately 21,000°C.
[1]
52 In the space in your answer booklet, list the stars, other than Bellatrix, found on
the chart in order of decreasing luminosity. Rigel, the most luminous star, has been
listed.
[1]
53 Explain why the constellation Orion is visible at night to an observer in New York
State in December and January, but not in June and July.
[1]
P.S./E. Sci.–Aug. ’08
[17]
[OVER]
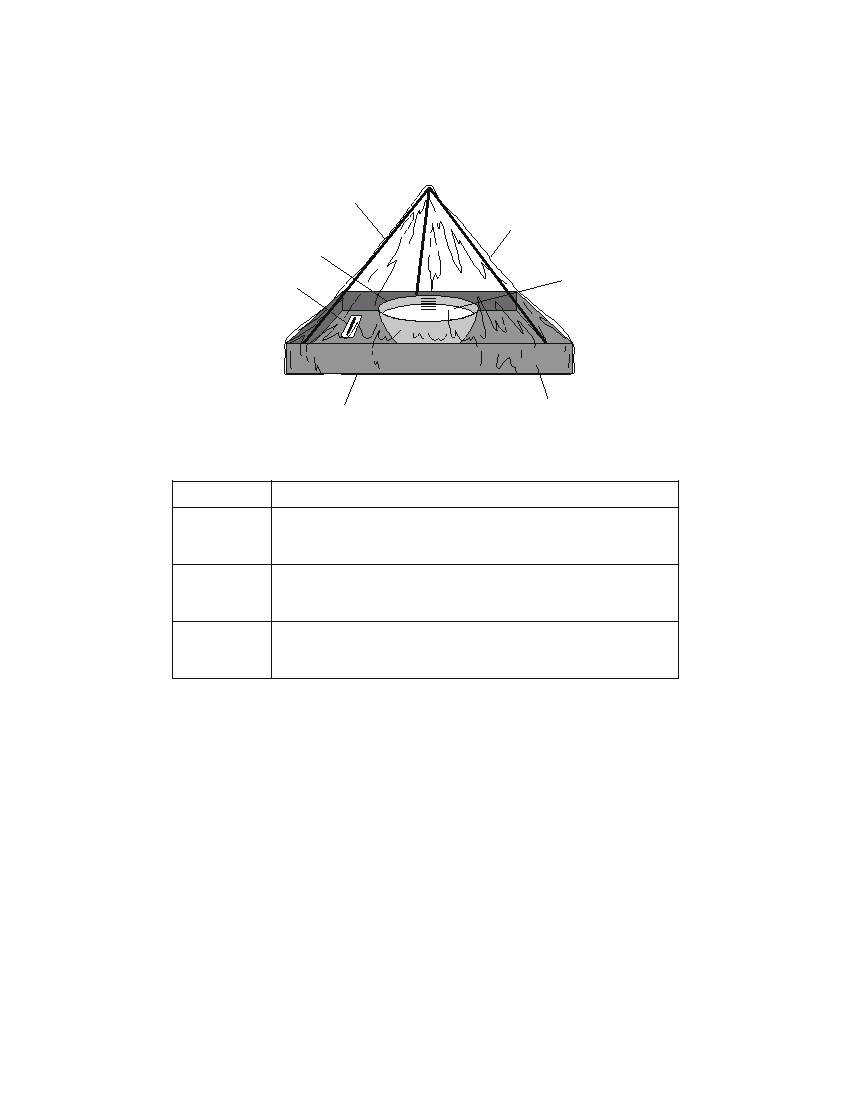
Base your answers to questions 54 through 57 on the model and data table shown below. A student con-
structed a model to demonstrate how water is recycled by natural processes on Earth. The model consisted of
a clear plastic tent over a pan containing a bowl of water. The model was sealed so no air could enter or leave
the tent. The data table shows the observations recorded when the model was placed in direct sunlight for
60 minutes.
Wire supports
Plastic tent
Bowl
Thermometer
Water level
Plastic wrapped
Tin pan
under pan
Data Table
Time (min)
Observations
Water level in bowl = 10 cm
0
Inside walls of the plastic tent are dry.
Inside air temperature = 20°C
Water level in bowl = 9.9 cm
30
Small drops of water form on the inside walls of the tent.
Inside air temperature = 23°C
Water level in bowl = 9.8 cm
60
Large drops of water form on the inside walls of the tent.
Inside air temperature = 26°C
54 Identify the process that caused the water level in the bowl to decrease.
[1]
55 How much heat energy, in calories per gram, is released as water droplets are formed
on the inside walls of the tent?
[1]
56 If the model is changed and the bowl of water is replaced with a green plant, by which
process would the plant supply water vapor to the air inside the tent? [1]
P.S./E. Sci.–Aug. ’08
[18]
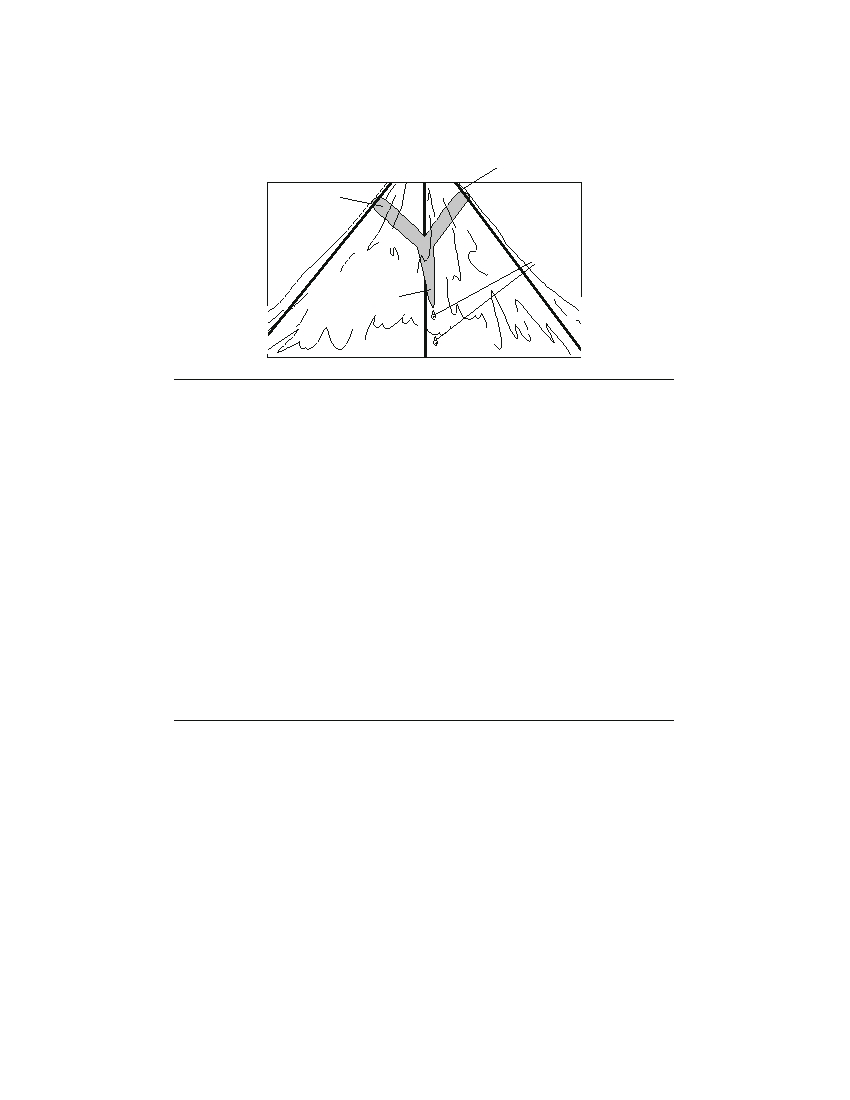
57 A student glues a Y-shaped piece of plastic, as shown below, near the top of the inside
of the tent and repeats the demonstration. Drops of water are seen dripping from the
bottom of the Y after 60 minutes. Which process of the water cycle is represented by
the dripping water?
[1]
Plastic sheet
Plastic “Y”
Drops of
water
Bottom section
of “Y” hanging
free of plastic
Base your answers to questions 58 through 61 on the map provided in your answer booklet, which shows
weather station models and some weather variables for a portion of the United States. Selected weather stations
are labeled A, B, and C .
58 On the map in your answer booklet, draw the 50°F isotherm. The isotherm must
extend to the edges of the map. [1]
59 State the air pressure, in millibars, at weather station A . [1]
60 The city represented by weather station B is currently being affected by an air mass
that originated over the Gulf of Mexico. What is the two-letter air-mass symbol used
to represent this air mass? [1]
61 Which weather condition is indicated by the present weather symbol at station C ? [1]
P.S./E. Sci.–Aug. ’08
[19]
[OVER]
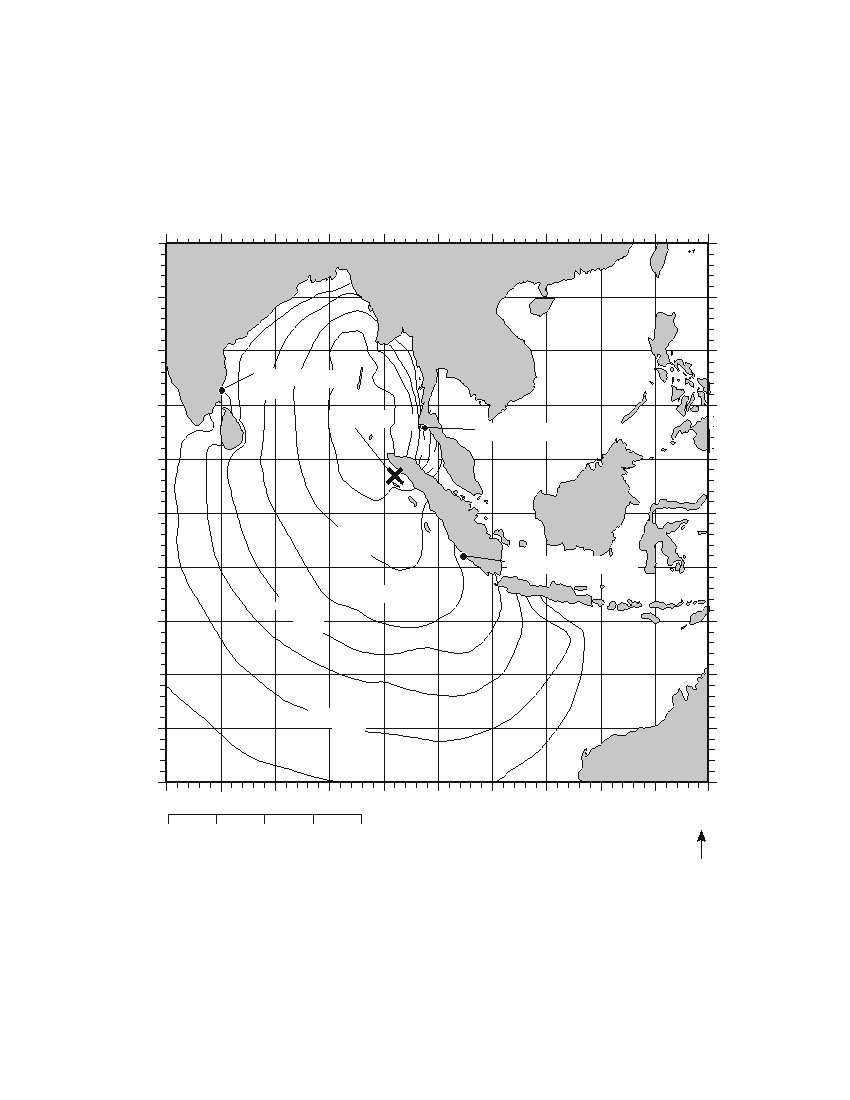
Base your answers to questions 62 through 65 on the map below and the cross sections on the next page.
The map shows a portion of the Indian Ocean and surrounding landmasses. The location of the epicenter of a
large undersea earthquake that occurred on December 26, 2004, is shown by an X . The isolines surrounding the
epicenter show the approximate location of the first tsunami wave produced by this earthquake in half-hour
intervals after the initial earthquake. Cross sections I and II illustrate how this undersea earthquake produced
the tsunami. Cross section III shows the tsunami approaching a shoreline. The cross sections are not drawn to
scale.
80 E
90 E
100 E
110 E
120 E
20 N
Asia
20 ° N
Pondicherry,
India
10 N
10 N
Epicenter
1
Phuket, Thailand
2
3
0
0
1
hour
Bengkulu, Sumatra
2
Indian Ocean
hours
10 S
10 S
3 hours
20 S
20 S
Australia
80 E
90 E
100 E
110 E
120 E
N
0
1000
2000 km
Isoline interval = 0.5 hours
P.S./E. Sci.–Aug. ’08
[20]
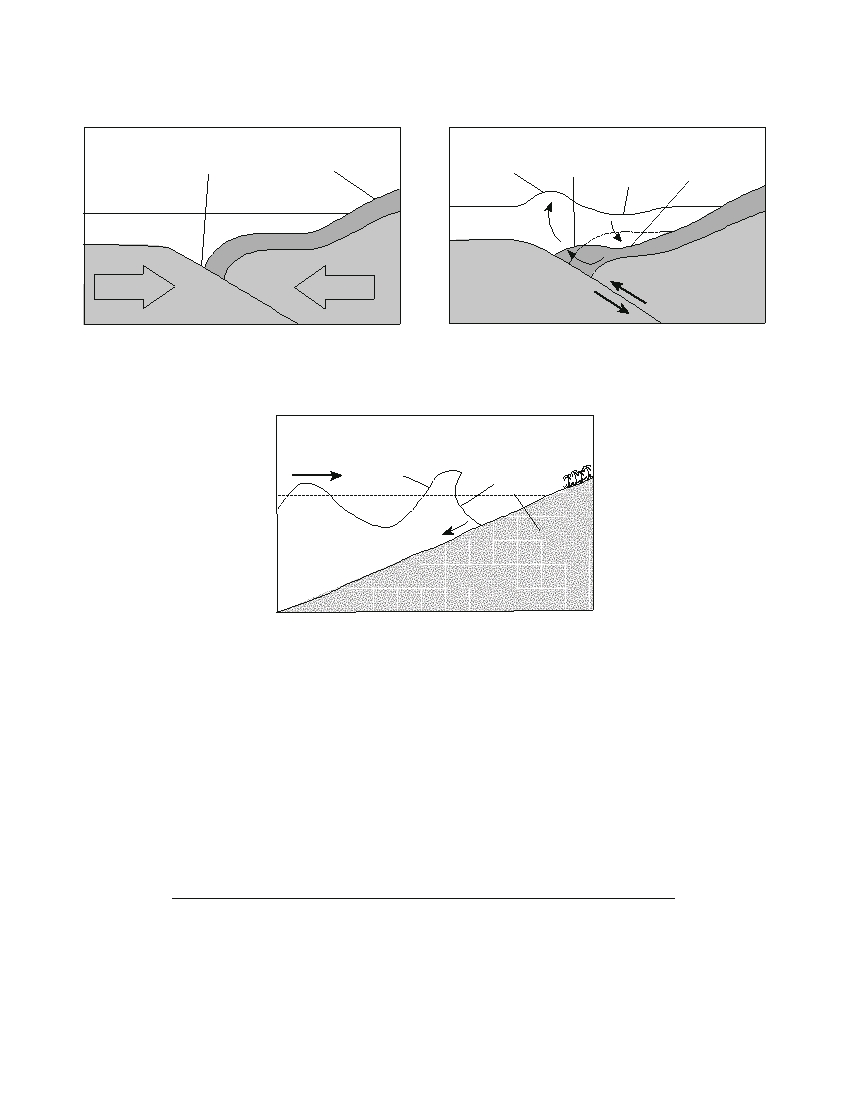
Cross section II
Cross section I
Chain reaction caused by tectonic plate motion
Tectonic setting before the earthquake occurred
and the resulting movement of the seafloor
Ocean
Land
Ocean
surface
Sunda Trench
surface
surface
Sumatra
raised
raised
lowered
Land surface
(crest)
(trough)
drops
Indian Ocean
Indian Ocean
Tectonic
Tectonic
Tectonic
plate
plate
plate
Tectonic
plate
Cross section III
As the tsunami moves into shallow waters and
approaches land, the trough reaches land before
the first wave crest hits land.
Receding
Tsunami
ocean waters
Normal sea
Indian Ocean
level
62 According to the map, how long after this earthquake did the first tsunami wave arrive
at Bengkulu, Sumatra?
[1]
63 State the latitude and longitude of the epicenter of this earthquake. Include the units
and compass directions in your answer.
[1 ]
64 Identify the overriding tectonic plate at the convergent plate boundary where this
earthquake occurred.
[1]
65 Based on cross section III, describe the ocean water-level change at the shoreline that
people observed just before the first tsunami wave approached the shore.
[1]
P.S./E. Sci.–Aug. ’08
[21]
[OVER]
Part C
Answer all questions in this part.
Directions (66–85): Record your answers in the spaces provided in your answer booklet. Some questions
may require the use of the Earth Science Reference Tables.
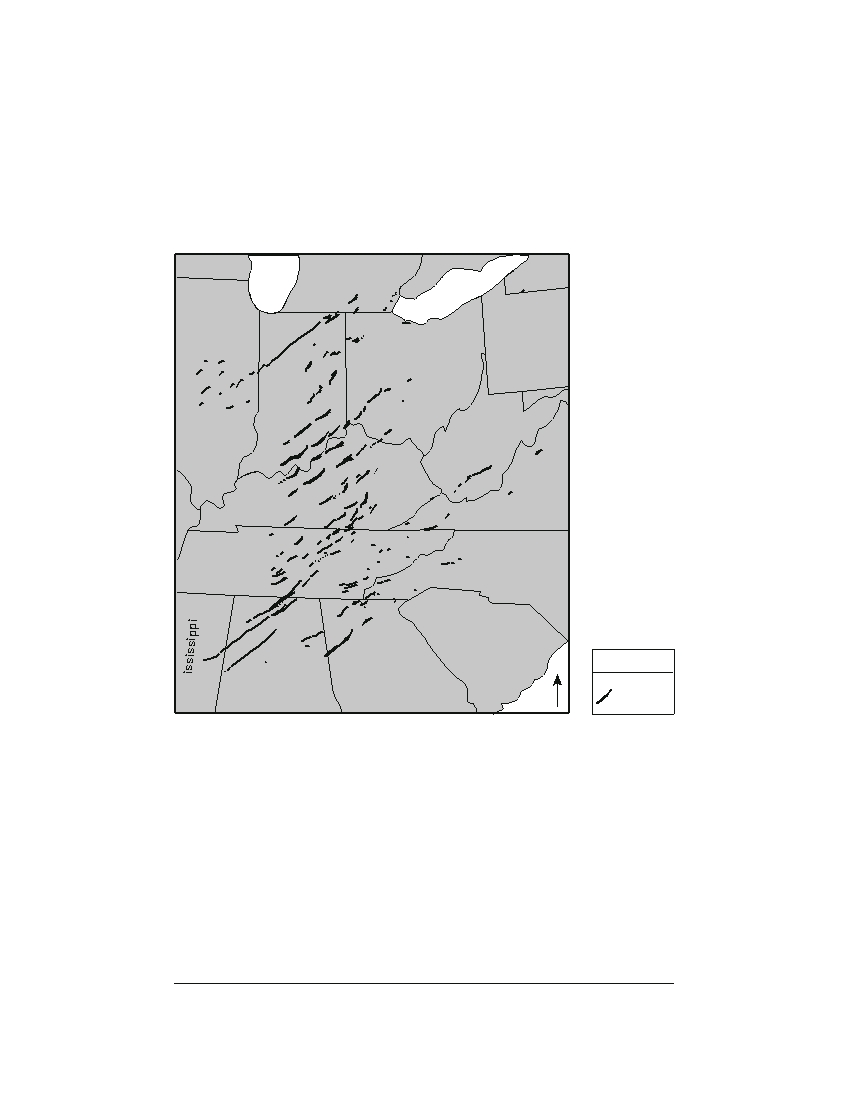
Base your answers to questions 66 through 69 on the map below, which shows a portion of the United States
where 148 tornadoes occurred during a 24-hour period in April 1974. The paths of the tornadoes are shown.
Wisconsin
New York
Michigan
Illinois
Pennsylvania
Ohio
Indiana
West
Virginia
Kentucky
Virginia
North Carolina
Tennessee
South
Carolina
Georgia
N
Key
M
Alabama
tornado
path
66 Explain why all the tornadoes moved toward the northeast.
[1]
67 Describe the air movement most likely found within these tornadoes.
[1]
68 A school receives a tornado warning. Describe one emergency action that a teacher
and the students in a classroom should immediately take to protect themselves from
injury.
[1]
69 Most of these tornadoes occurred with thunderstorms along cold fronts. Identify the
water cycle process that forms clouds along cold fronts.
[1]
P.S./E. Sci.–Aug. ’08
[22]

Base your answers to questions 70 and 71 on the data table below, which shows the diameters of three
particles, A, B, and C, made of the same uniform material. These particles were carried by a stream into a lake.
Data Table
Particle
Particle
Diameter
(cm)
A
0.5
B
1.0
C
0.1
70 The cross-sectional diagram in your answer booklet shows the stream entering the
lake. On the diagram, indicate the expected pattern of deposition of the three
particles by placing the letters A, B, and C in the appropriate boxes along the lake
bottom.
[1]
71 Explain why the particles are deposited after the stream enters the lake.
[1]
Base your answers to questions 72 through 76 on the diagram in your answer booklet, which represents a
model of the sky above a vertical post in New York State. The diagram shows the position of the Sun at solar
noon on September 23 and the position of Polaris above the horizon.
72 On the diagram in your answer booklet, draw the apparent path of the Sun across the
sky on September 23 from sunrise to sunset.
[1]
73 On the diagram in your answer booklet, draw the shadow of the vertical post as it
would appear at solar noon on September 23.
[1]
74 Place an X on the diagram in your answer booklet to indicate the altitude of the Sun
at solar noon on June 21.
[1]
75 How many degrees will the Sun appear to move across the sky from 1 p.m. to 3 p.m.
on June 21?
[1]
76 At which latitude is this vertical post located? Include the unit and compass direc-
tion in your answer.
[1]
P.S./E. Sci.–Aug. ’08
[23]
[OVER]
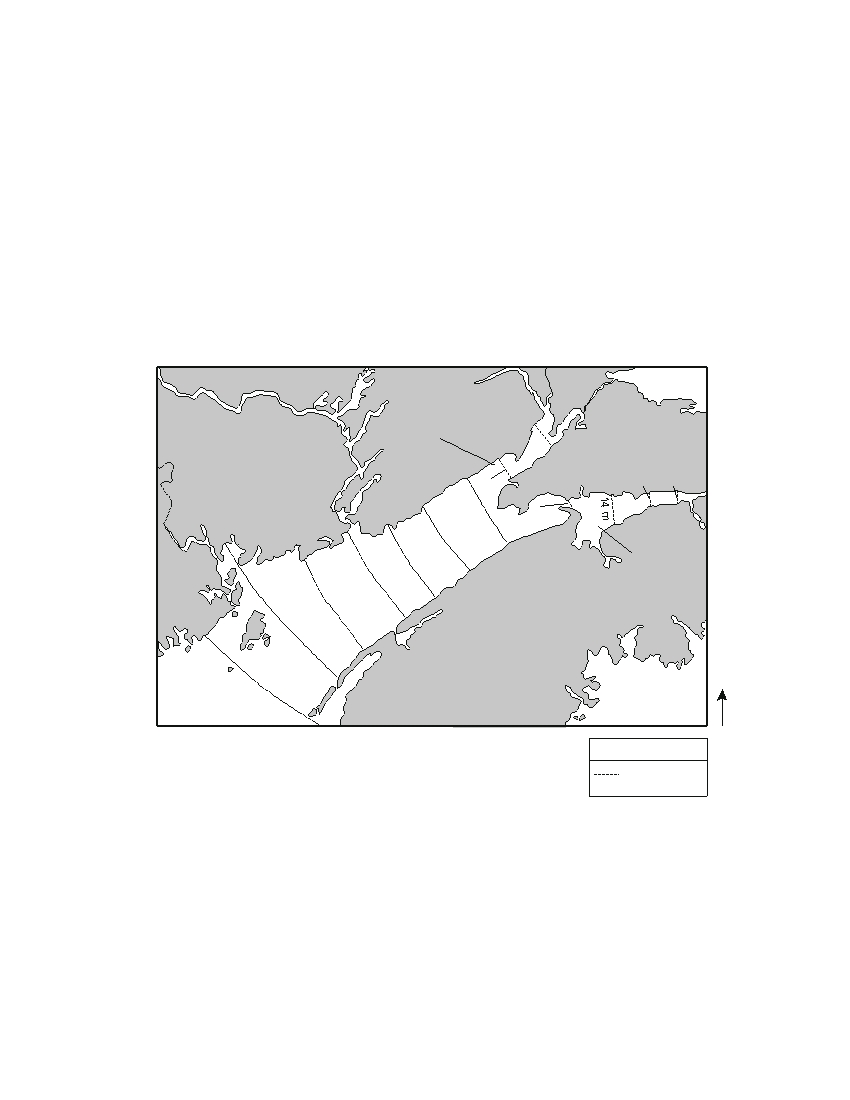
Base your answers to questions 77 through 81 on the passage and map below and the tide table on the next
page. The map shows the tidal range (the difference between the highest and lowest tides) in meters for the Bay
of Fundy, Chignecto Bay, and the Minas Basin. The table shows the times of high and low tides for Hopewell
Cape for August 21 and 22, 2005.
The Bay of Fundy has the Highest Tides on Earth
The unique shape of the Bay of Fundy contributes to the extremely high ocean
tides experienced there.
Frequently described as funnel shaped, the bay gradually
becomes more narrow and shallow to the northeast where it splits to form Chignecto
Bay and the Minas Basin. The highest tides of the Bay of Fundy are found within these
fingers of the bay and are caused by the incoming tides encountering seaward-moving
river currents as the bay narrows. The tide height is also affected by the amount of
time it takes for high tide to flood the bay. This time is nearly identical from one high
tide to the next.
Hopewell
Chignecto
Cape
14
Bay
m
New Brunswick
(Canada)
13
m
15 m 16 m
12
13
m
m
Minas
F 10
u
n
d 11
y
m
Maine
m
Basin
(U.S.)
o
f
9
B
a
y
m
8
m
7
Nova Scotia
m
(Canada)
Atlantic
6
m
Atlantic
N
Ocean
Ocean
Key
Tidal range
P.S./E. Sci.–Aug. ’08
[24]
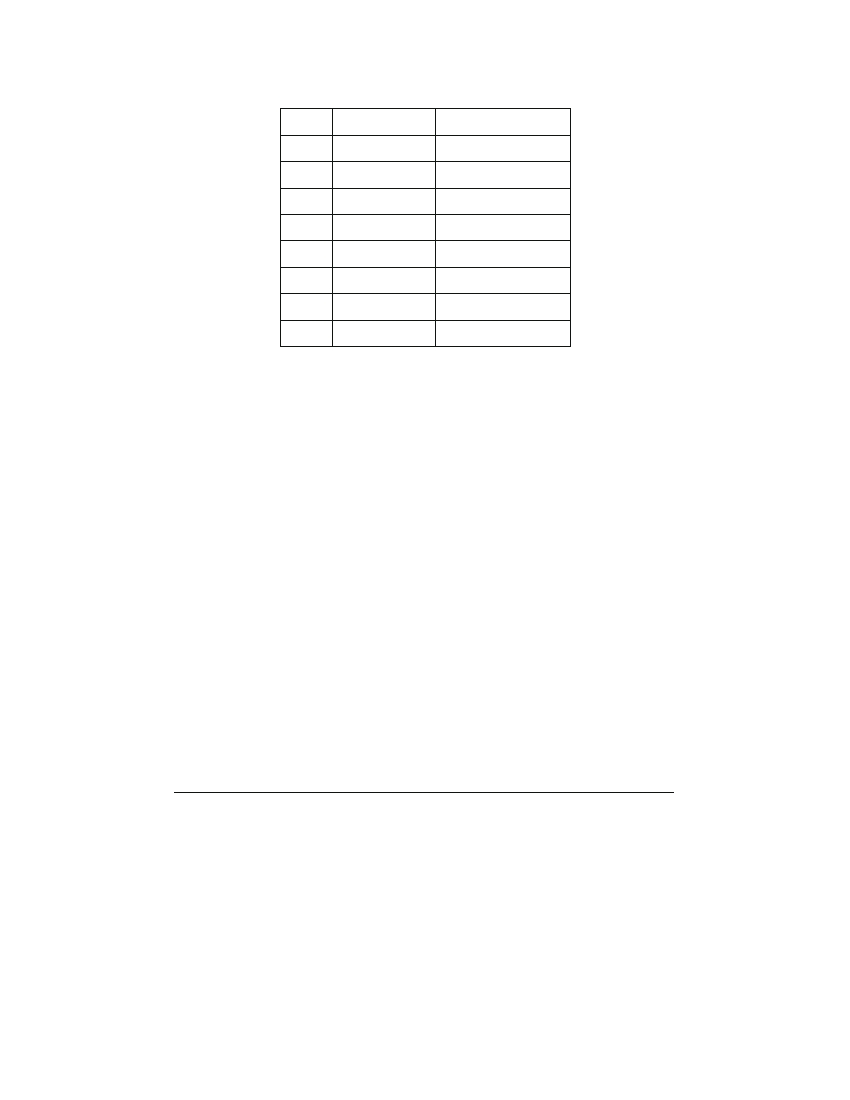
Hopewell Cape
Tide Table, August 2005
Date
Time
Tide Height (m)
21
1:28 a.m.
14.0
21
8:03 a.m.
–0.1
21
1:54 p.m.
13.7
21
8:26 p.m.
0.0
22
2:20 a.m.
14.0
22
8:52 a.m.
–0.2
22
2:46 p.m.
13.8
22
9:16 p.m.
0.0
77 Describe two characteristics of the Bay of Fundy that cause the extremely high tides
to occur at Hopewell Cape.
[1]
78 On the grid in your answer booklet, plot with an X the height of the water for each
time listed on the tide table. Connect the centers of the X s with a smooth, curved
line.
[1]
79 Using the tide table for Hopewell Cape, calculate the time difference between two
consecutive high tides. Express your answer to the nearest minute.
[1]
80 The diagram in your answer booklet shows an observer standing near a measuring
stick at the 0-meter tide height location at Hopewell Cape. The diagram is drawn to
a scale of 1 centimeter equals 2 meters. On the measuring stick, place an X to show
the highest tide level shown on the tide table for August 21.
[1]
81 The diagram in your answer booklet shows the Moon’s orbital path and Earth as
viewed from space. The points on Earth indicate two locations where high ocean
tides are occurring. Place an X on the Moon’s orbital path to show where the Moon
could be located when these high tides are produced.
[1]
P.S./E. Sci.–Aug. ’08
[25]
[OVER]
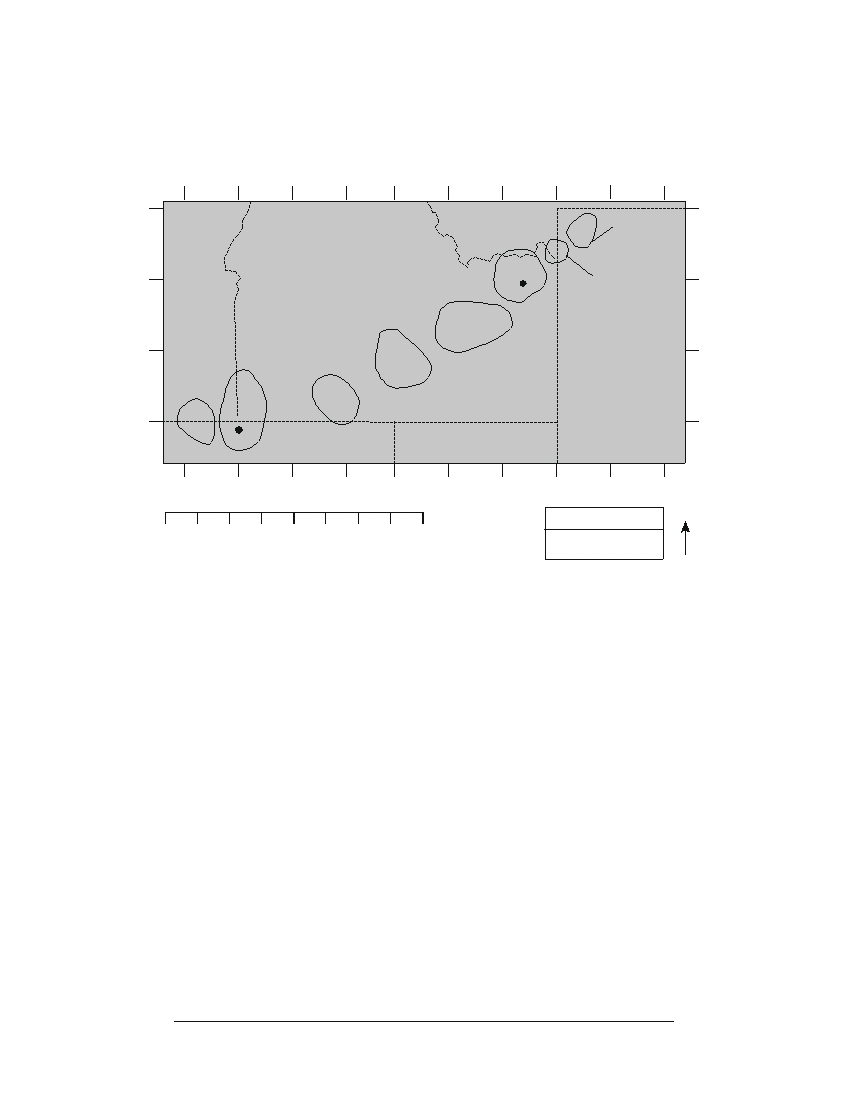
Base your answers to questions 82 through 85 on the map and passage below. The map shows the outlines
and ages of several calderas created as a result of volcanic activity over the last 16 million years as the North
American Plate moved over the Yellowstone Hot Spot. A and B represent locations within the calderas.
Yellowstone Volcanic Calderas
118 W
116 W
114 W
112 W
110 W
Montana
Idaho
0.63 my
5 my
44 N
1.3 my
44 N
Oregon
B
8.5 my
9.5 my
Wyoming
15
my
11 my
16
42 N
my
42 N
A
Nevada
Utah
118 W
116 W
114 W
112 W
110 W
Key
N
0
25
50
75
100 125 150 175 200 miles
my = million years
The Yellowstone Hot Spot
The Yellowstone Hot Spot has interacted with the North American Plate, causing
widespread outpourings of basalt that buried about 200,000 square miles under layers
of lava flows that are a half mile or more thick. Some of the basaltic magma produced
by the hot spot accumulates near the base of the plate, where it melts the crust above.
The melted crust, in turn, rises closer to the surface to form large reservoirs of poten-
tially explosive rhyolite magma. Catastrophic eruptions have partly emptied some of
these reservoirs, causing their roofs to collapse. The resulting craters, some of which
are more than 30 miles across, are known as volcanic calderas.
82 Describe the texture and color of the basalt produced by the Yellowstone Hot Spot. [1]
83 Identify two minerals found in the igneous rock that is produced from the explosive
rhyolite magma.
[1]
84 Based on the age pattern of the calderas shown on the map, in which compass
direction has the North American Plate moved during the last 16 million years?
[1]
85 Calculate, in miles per million years, the rate at which the North American Plate has
moved over the Yellowstone Hot Spot between point A and point B.
[1]
P.S./E. Sci.–Aug. ’08
[26]

The University of the State of New York
R EGENTS H IGH S CHOOL E XAMINATION
PHYSICAL SETTING
EARTH SCIENCE
Wednesday, August 13, 2008 — 12:30 to 3:30 p.m., only
ANSWER SHEET
Student . . . . . . . . . . . . . . . . . . . . . . . . . . . . . . . . . . . . . . . . . . . . . . .
Sex:
I Male
I Female
Grade . . . . . . . . . . . .
Teacher . . . . . . . . . . . . . . . . . . . . . . . . . . . . . . . . . . . . . . . . . . . . . . .
School
. . . . . . . . . . . . . . . . . . . . . . . . . . . . . . . . . . . .
Record your answers to Part A and Part B–1 on this answer sheet.
Part A
Part B–1
1 . . . . . . . . . . . .
13 . . . . . . . . . . . .
25 . . . . . . . . . . .
36 . . . . . . . . . . . .
44 . . . . . . . . . . . .
2 . . . . . . . . . . . .
14 . . . . . . . . . . . .
26 . . . . . . . . . . .
37 . . . . . . . . . . . .
45 . . . . . . . . . . . .
3 . . . . . . . . . . . .
15 . . . . . . . . . . . .
27 . . . . . . . . . . .
38 . . . . . . . . . . . .
46 . . . . . . . . . . . .
4 . . . . . . . . . . . .
16 . . . . . . . . . . . .
28 . . . . . . . . . . .
39 . . . . . . . . . . . .
47 . . . . . . . . . . . .
5 . . . . . . . . . . . .
17 . . . . . . . . . . . .
29 . . . . . . . . . . .
40 . . . . . . . . . . . .
48 . . . . . . . . . . . .
6 . . . . . . . . . . . .
18 . . . . . . . . . . . .
30 . . . . . . . . . . .
41 . . . . . . . . . . . .
49 . . . . . . . . . . . .
7 . . . . . . . . . . . .
19 . . . . . . . . . . . .
31 . . . . . . . . . . .
42 . . . . . . . . . . . .
50 . . . . . . . . . . . .
Part B–1 Score
8 . . . . . . . . . . . .
20 . . . . . . . . . . . .
32 . . . . . . . . . . .
43 . . . . . . . . . . . .
9 . . . . . . . . . . . .
21 . . . . . . . . . . . .
33 . . . . . . . . . . .
10 . . . . . . . . . . . .
22 . . . . . . . . . . . .
34 . . . . . . . . . . .
11 . . . . . . . . . . . .
23 . . . . . . . . . . . .
35 . . . . . . . . . . .
Part A Score
12 . . . . . . . . . . . .
24 . . . . . . . . . . . .
Write your answers to Part B–2 and Part C in your answer booklet.
The declaration below must be signed when you have completed the examination.
I do hereby affirm, at the close of this examination, that I had no unlawful knowledge of the questions or answers prior to
the examination and that I have neither given nor received assistance in answering any of the questions during the examination.
Signature

PS/EARTH SCIENCE
E C N E I C S H T R A E / S P