
PS/EARTH SCIENCE
The University of the State of New York
REGENTS HIGH SCHOOL EXAMINATION
PHYSICAL SETTING
EARTH SCIENCE
Thursday, August 16, 2007 — 12:30 p.m. to 3:30 p.m., only
This is a test of your knowledge of Earth science. Use that knowledge to answer
all questions in this examination. Some questions may require the use of the Earth
Science Reference Tables. The Earth Science Reference Tables are supplied separately.
Be certain you have a copy of the 2001 Edition (Revised November 2006) of these
reference tables before you begin the examination.
Your answer sheet for Part A and Part B–1 is the last page of this examination
booklet. Turn to the last page and fold it along the perforations. Then, slowly and
carefully, tear off your answer sheet and fill in the heading.
The answers to the questions in Part B–2 and Part C are to be written in your
separate answer booklet. Be sure to fill in the heading on the front of your answer
booklet.
You are to answer all questions in all parts of this examination according to the
directions provided in the examination booklet. Record your answers to the Part A
and Part B–1 multiple-choice questions on your separate answer sheet. Write your
answers to the Part B–2 and Part C questions in your answer booklet. All work should
be written in pen, except for graphs and drawings, which should be done in pencil.
You may use scrap paper to work out the answers to the questions, but be sure to
record all your answers on your separate answer sheet and in your answer booklet.
When you have completed the examination, you must sign the statement printed
at the end of your separate answer sheet, indicating that you had no unlawful
knowledge of the questions or answers prior to the examination and that you have
neither given nor received assistance in answering any of the questions during the
examination. Your answer sheet and answer booklet cannot be accepted if you fail to
sign this declaration.
Notice. . .
A four-function or scientific calculator and a copy of the 2001 Earth Science Reference Tables
(Revised November 2006) must be available for you to use while taking this examination.
The use of any communications device is strictly prohibited when taking this
examination. If you use any communications device, no matter how briefly, your
examination will be invalidated and no score will be calculated for you.
DO NOT OPEN THIS EXAMINATION BOOKLET UNTIL THE SIGNAL IS GIVEN.
E C N E I C S H T R A E / S P
Part A
Answer all questions in this part.
Directions (1–35): For each statement or question, write on your separate answer sheet the number of the
word or expression that, of those given, best completes the statement or answers the question. Some questions
may require the use of the Earth Science Reference Tables .
1 Scientists can plan to photograph a solar eclipse
6 Astronomers viewing light from distant galaxies
because most astronomical events are
observe a shift of spectral lines toward the red
(1) cyclic and predictable
end of the visible spectrum. This shift provides
(2) cyclic and unpredictable
evidence that
(3) random and predictable
(1) orbital velocities of stars are decreasing
(4) random and unpredictable
(2) Earth’s atmosphere is warming
(3) the Sun is cooling
(4) the universe is expanding
2 The Coriolis effect causes winds in New York
State to generally curve
(1) to the right of the direction of travel
7 How many calories are required to evaporate
(2) to the left of the direction of travel
1 gram of boiling water?
(3) upward away from Earth’s surface
(1) 1
(3) 540
(4) downward toward Earth’s surface
(2) 80
(4) 620
3 In New York State, the constellation Pisces can
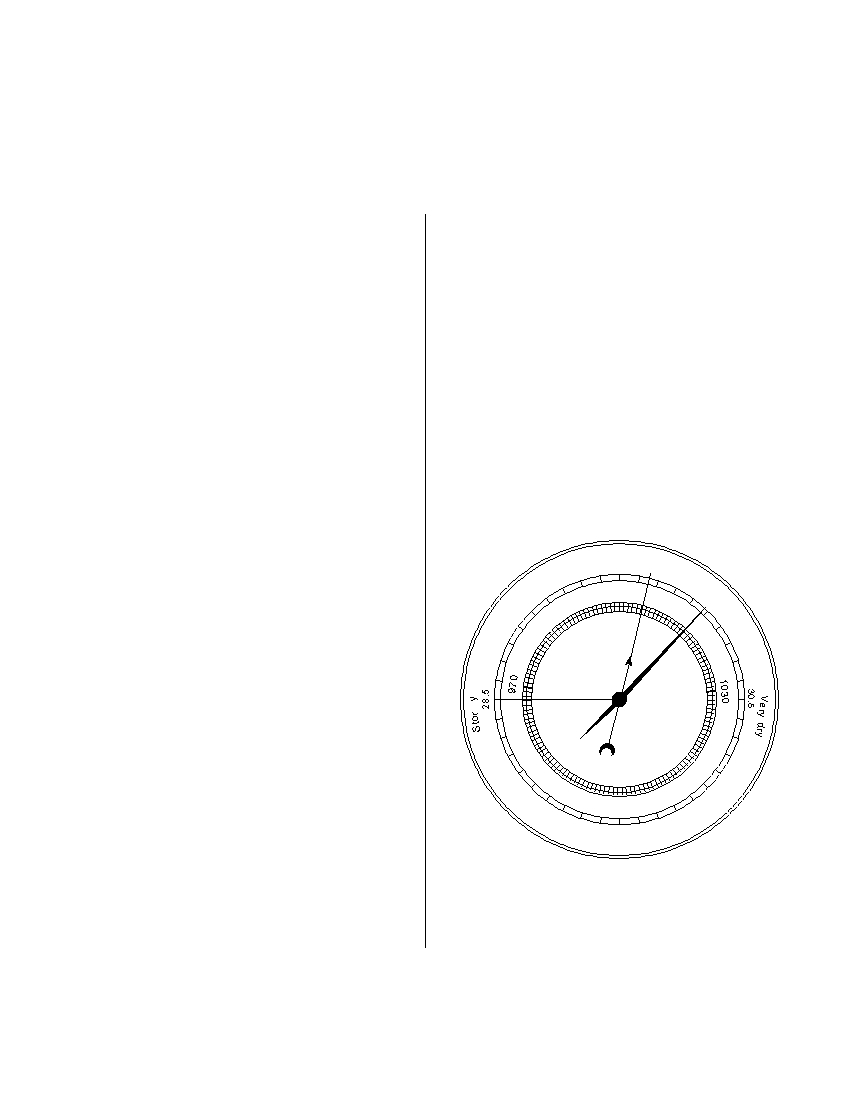
8 A weather instrument is shown below.
be seen in the night sky between the middle of
summer and the middle of winter. The constella-
tion Scorpio can be seen in the night sky between
Change
29.5 in
early spring and early fall. The reason these two
constellations can be viewed only at these times
1 0 0 0 m b
1010
30
29
Fair
is a direct result of Earth’s
990
Rain
(1) spin on its axis
1020
980
(2) movement around the Sun
(3) axis having a 23.5° tilt
(4) distance from the Sun
m
960
4 Approximately how many degrees per day does
1040
Earth revolve in its orbit around the Sun?
950
(1) 1°
(3) 15°
28
1050
(2) 13°
(4) 23.5°
940
31
1060
31.5
5 Compared with our Sun, the star Betelgeuse is
(1) smaller, hotter, and less luminous
(2) smaller, cooler, and more luminous
Which weather variable is measured by this
(3) larger, hotter, and less luminous
instrument?
(4) larger, cooler, and more luminous
(1) wind speed
(3) cloud cover
(2) precipitation
(4) air pressure
P.S./E. Sci.–August ’07
[2]
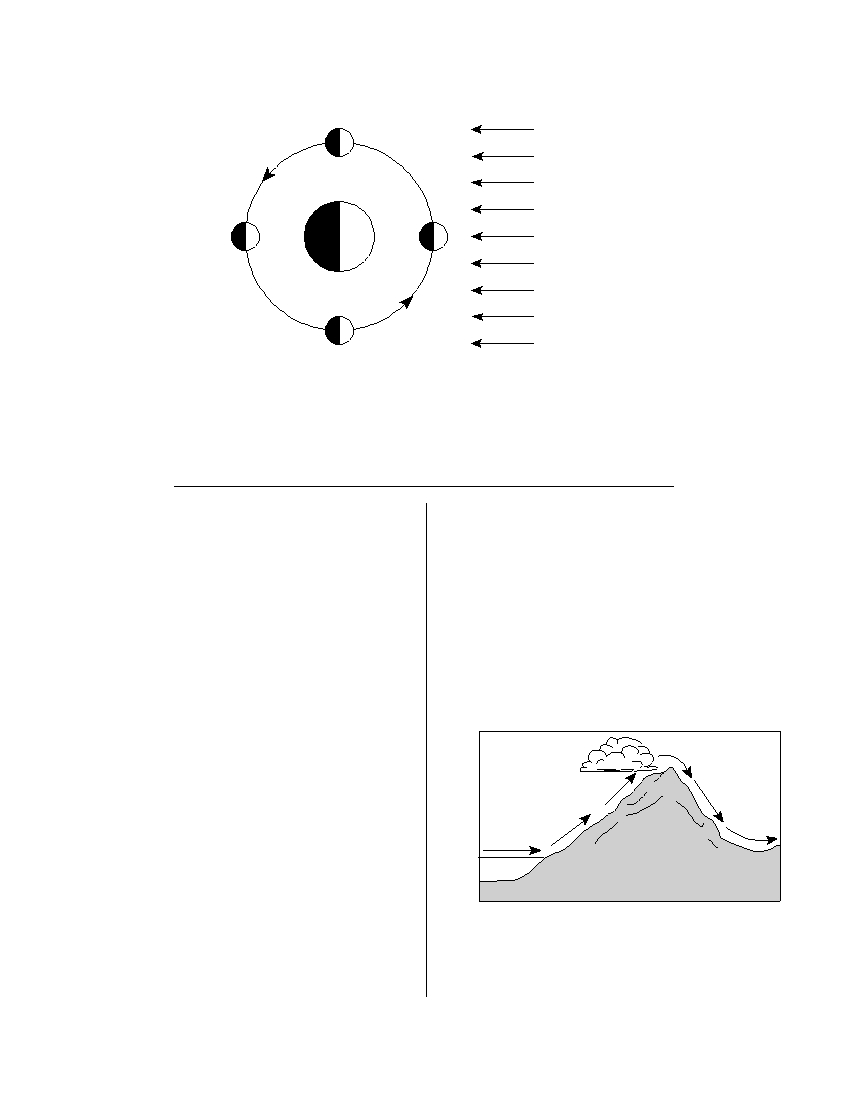
9 The diagram below represents the Sun’s rays striking Earth and the Moon. Numbers 1 through 4 represent
positions of the Moon in its orbit around Earth.
4
1
3
Sun’s rays
Earth
2
(Not drawn to scale)
The highest tides on Earth occur when the Moon is in positions
(1) 1 and 3
(3) 3 and 2
(2) 2 and 4
(4) 4 and 1
10 Most of the solar radiation absorbed by Earth’s
14 Earth’s surface winds generally blow from regions
surface is later radiated back into space as which
of higher
type of electromagnetic radiation?
(1) air temperature toward regions of lower air
(1) x ray
(3) infrared
temperature
(2) ultraviolet
(4) radio wave
(2) air pressure toward regions of lower air pressure
(3) latitudes toward regions of lower latitudes
(4) elevations toward regions of lower elevations
11 In
the
United
States,
most
tornadoes
are
classified as intense
(1) low-pressure funnel clouds that spin clockwise
15 The diagram below shows how prevailing winds
(2) low-pressure funnel clouds that spin counter-
cause
different
weather
conditions
on
the
clockwise
windward and leeward sides of a mountain range.
(3) high-pressure funnel clouds that spin clockwise
(4) high-pressure
funnel
clouds
that
spin
Leeward
counterclockwise
Windward
side
side
12 Which type of air mass is associated with warm,
dry atmospheric conditions?
Wind
Mountain
(1) cP
(3) mP
(2) cT
(4) mT
Ocean
13 The approximate latitude of Utica, New York, is
Clouds usually form on the windward sides of
(1) 43°05' N
(3) 75°15' E
mountains because this is where air
(2) 43°05' S
(4) 75°15' W
(1) rises and cools
(3) sinks and cools
(2) rises and warms
(4) sinks and warms
P.S./E. Sci.–August ’07
[3]
[OVER]
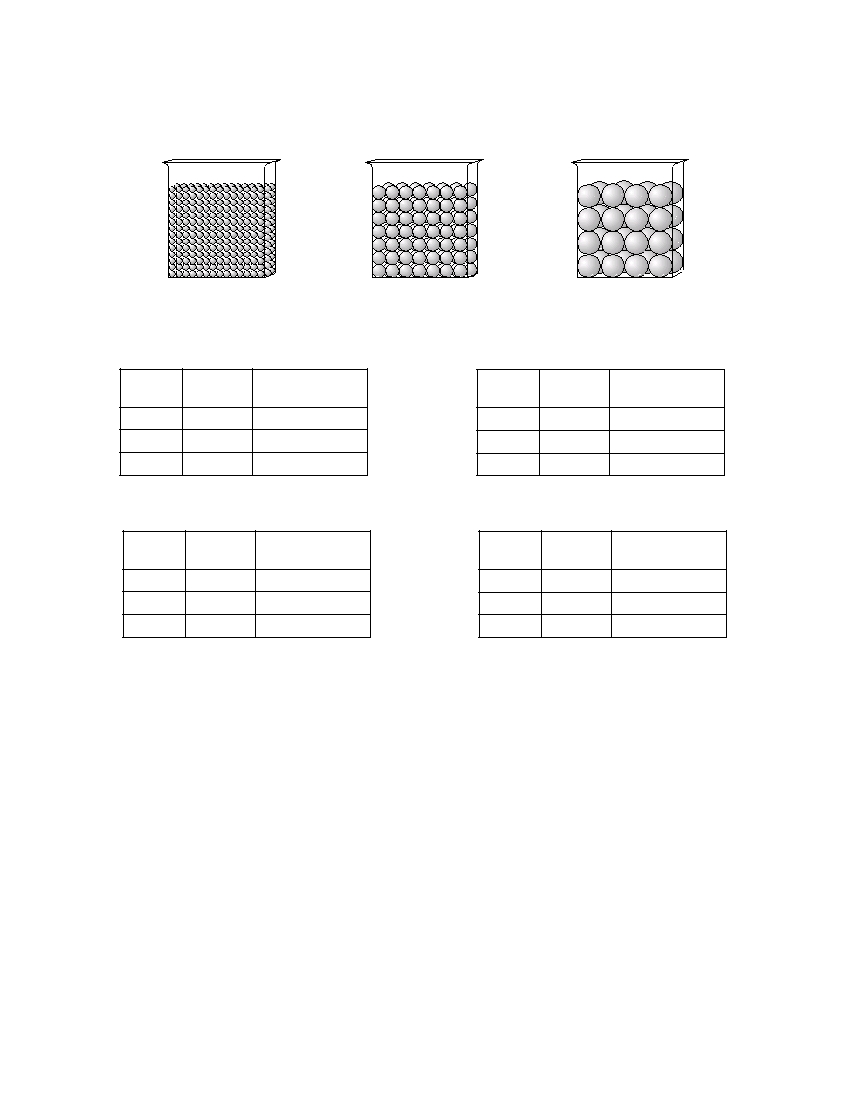
16 The diagrams below represent three containers, A , B , and C , which were filled with equal volumes of
uniformly sorted plastic beads. Water was poured into each container to determine porosity and infiltration
time.
A
B
C
(Not drawn to scale)
Which data table best represents the porosity and infiltration time of the beads in the three containers?
Beaker
Porosity
Infiltration Time
Beaker
Porosity
Infiltration Time
(%)
(sec)
(%)
(sec)
A
40
5.2
A
20
5.2
B
40
2.8
B
30
2.8
C
40
0.4
C
40
0.4
(1)
(3)
Beaker
Porosity
Infiltration Time
Beaker
Porosity
Infiltration Time
(%)
(sec)
(%)
(sec)
A
40
0.4
A
20
0.4
B
40
2.8
B
30
2.8
C
40
5.2
C
40
5.2
(2)
(4)
P.S./E. Sci.–August ’07
[4]
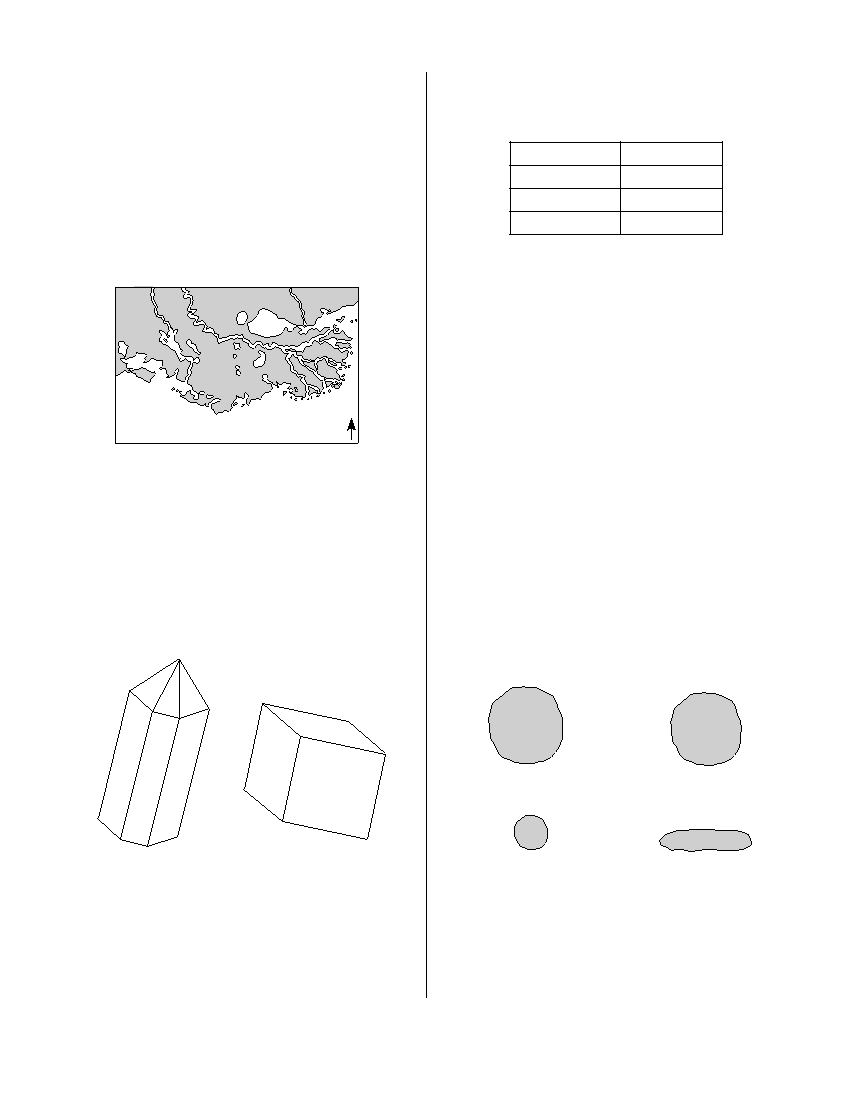
17 Which ocean current brings warm water to the
20 A student created the table below by classifying
western coast of Africa?
six minerals into two groups, A and B , based on a
(1) Agulhas Current
single property.
(2) North Equatorial Current
(3) Canaries Current
Group A
Group B
(4) Guinea Current
olivine
pyrite
garnet
galena
18 The map below shows the large delta that formed
calcite
graphite
as the Mississippi River emptied into the Gulf of
Mexico.
Which property was used to classify these minerals?
(1) color
(2) luster
(3) chemical composition
(4) hardness
21 Which igneous rock has a vesicular texture and
N
contains the minerals potassium feldspar and
Gulf of Mexico
quartz?
(1) andesite
(3) pumice
Which process was primarily responsible for the
(2) pegmatite
(4) scoria
formation of the delta?
(1) glacial erosion
22 Dolostone is classified as which type of rock?
(2) cementation of sediment
(1) land-derived sedimentary rock
(3) deposition of sediment
(2) chemically formed sedimentary rock
(4) mass movement
(3) foliated metamorphic rock
(4) nonfoliated metamorphic rock
19 The diagrams below show the crystal shapes of
two minerals.
23 A stream is transporting the particles W , X , Y ,
and Z , shown below.
W
Y
Density = 3.8 g/mL
Density = 2.4 g/mL
X
Z
Quartz
Halite
Density = 3.8 g/mL
Density = 2.4 g/mL
Quartz and halite have different crystal shapes
Which particle will most likely settle to the bottom
primarily because
first as the velocity of this stream decreases?
(1) light reflects from crystal surfaces
(1) W
(3) Y
(2) energy is released during crystallization
(2) X
(4) Z
(3) of impurities that produce surface variations
(4) of the internal arrangement of the atoms
P.S./E. Sci.–August ’07
[5]
[OVER]
24 What is Earth’s inferred interior pressure, in
27 The movement of tectonic plates is inferred by
millions of atmospheres, at a depth of 3500
many scientists to be driven by
kilometers?
(1) tidal motions in the hydrosphere
(1) 1.9
(3) 5500
(2) density differences in the troposphere
(2) 2.8
(4) 6500
(3) convection currents in the asthenosphere
(4) solidification in the lithosphere
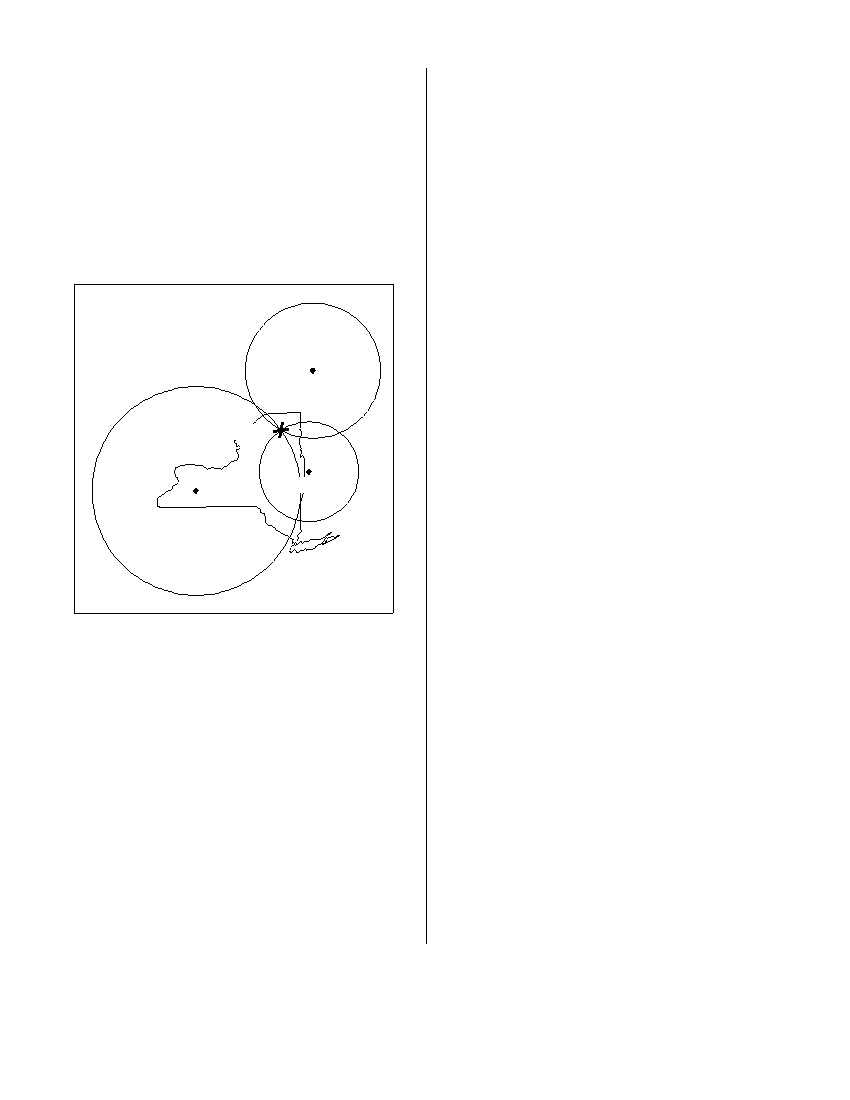
25 The map below shows the location of an
earthquake epicenter in New York State. Seismic
28 Which two tectonic plates are separated by a
stations A , B , and C received the data used to
mid-ocean ridge?
locate the earthquake epicenter.
(1) Indian-Australian and Eurasian
(2) Indian-Australian and Pacific
(3) North American and South American
(4) North American and Eurasian
Station C
29 The presence of brachiopod, nautiloid, and coral
fossils in the surface bedrock of a certain area
indicates the area was once covered by
(1) tropical vegetation
(3) volcanic ash
Epicenter
(2) glacial deposits
(4) ocean water
Station A
30 New York State’s Catskills are classified as which
Station B
type of landscape region?
(1) mountain
(3) lowland
(2) plateau
(4) plain
31 What is the relative humidity if the dry-bulb
temperature
is
22°C
and
the
wet-bulb
temperature is 17°C?
The seismogram recorded at station A would
(1) 5%
(3) 60%
show the
(2) 14%
(4) 68%
(1) arrival of P -waves, only
(2) earliest arrival time of P -waves
(3) greatest difference in the arrival times of
P -waves and S -waves
(4) arrival of S -waves before the arrival of
P -waves
26 An earthquake’s first P -wave arrives at a seismic
station at 12:00:00.
This P -wave has traveled
6000 kilometers from the epicenter.
At what
time will the first S -wave from the same
earthquake arrive at the seismic station?
(1) 11:52:20
(3) 12:09:20
(2) 12:07:40
(4) 12:17:00
P.S./E. Sci.–August ’07
[6]
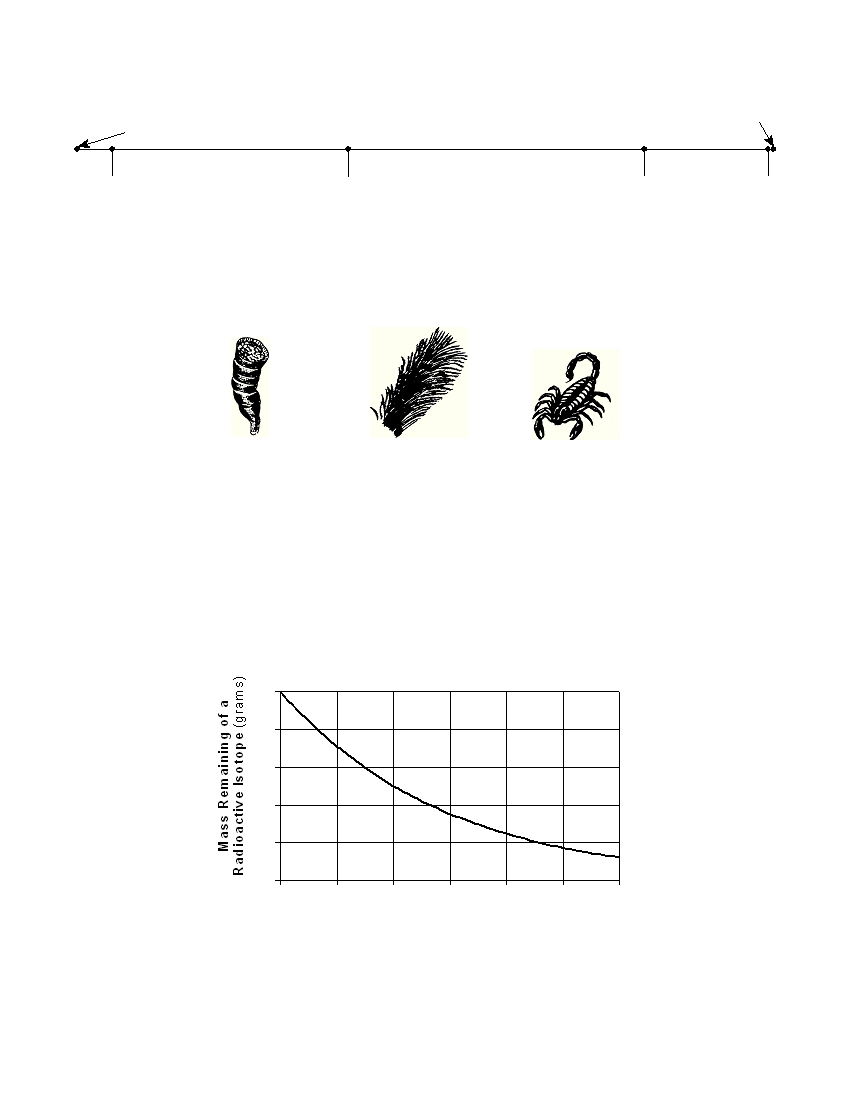
32 The time line below represents the entire geologic history of Earth.
The present
Origin of Earth
(today)
A
B
C
D
Which letter best represents the first appearance of humans on Earth?
(1) A
(3) C
(2) B
(4) D
33 Three extinct organisms are shown in the diagrams below.
Cystiphyllum ,
Baragwanathia ,
Palaeophonus ,
a solitary coral
a lycopod — an
a scorpion — one of
early land plant
the first land animals
Which other life-form reached its peak development during the same period in
geologic history that these three life-forms first appeared on Earth?
(1) dinosaurs
(3) mastodonts
(2) stromatolites
(4) eurypterids
34 The graph below shows the radioactive decay of a 50-gram sample of a radioactive isotope.
50
40
30
20
10
0
0
100
200
300
400
500
600
Time (years)
According to the graph, what is the half-life of this isotope?
(1) 100 years
(3) 200 years
(2) 150 years
(4) 300 years
P.S./E. Sci.–August ’07
[7]
[OVER]
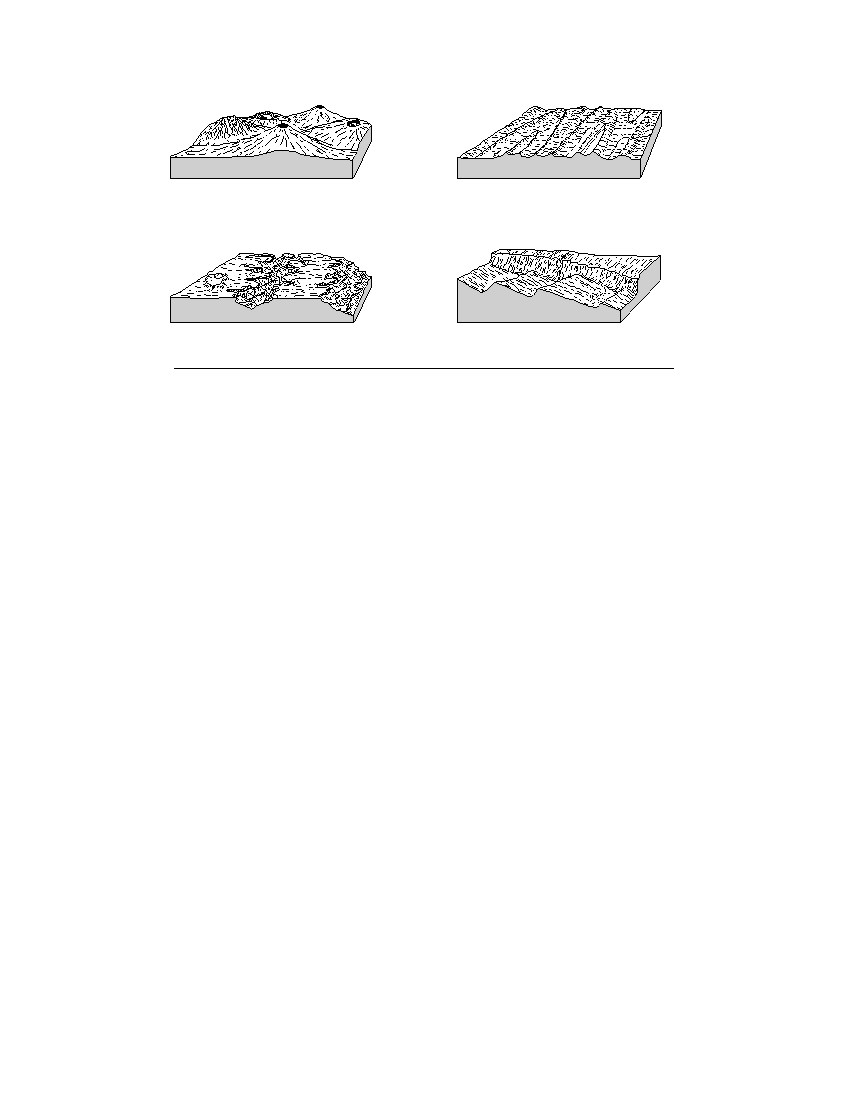
35 Which diagram represents a landscape where fine-grained igneous bedrock is most likely to be found?
( 1 )
( 3 )
( 2 )
( 4 )
P.S./E. Sci.–August ’07
[8]
Part B–1
Answer all questions in this part.
Directions (36–50): For each statement or question, write on your separate answer sheet the number of the
word or expression that, of those given, best completes the statement or answers the question. Some
questions may require the use of the Earth Science Reference Tables .
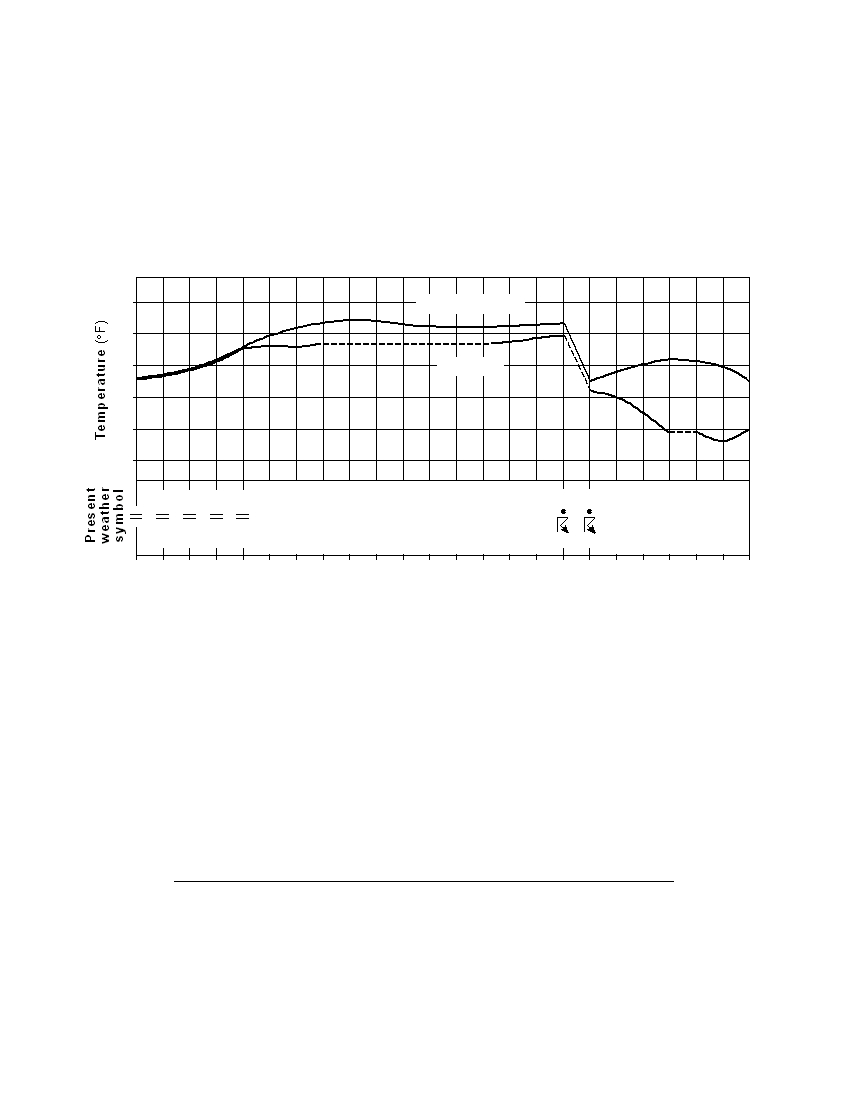
Base your answers to questions 36 and 37 on the graph below, which shows air temperature, dewpoint, and
present weather conditions for a 23-hour period at Dallas, Texas.
80
Air temperature
70
60
Dewpoint
50
40
30
7
8
9
10 11 12
1
2
3
4
5
6
7
8
9
10 11 12
1
2
3
4
5
6
a.m.
noon
p.m.
mid-
a.m.
night
36 The thunderstorm that occurred between 11 p.m. and 12 midnight was most likely
the result of
(1) the arrival of a warm front
(2) the arrival of a cold front
(3) an increase in the difference between air temperature and dewpoint
(4) an increase in both air temperature and dewpoint
37 Which weather condition was reported at Dallas when the air temperature was equal
to the dewpoint?
(1) fog
(3) thunderstorm
(2) rain
(4) drizzle
P.S./E. Sci.–August ’07
[9]
[OVER]
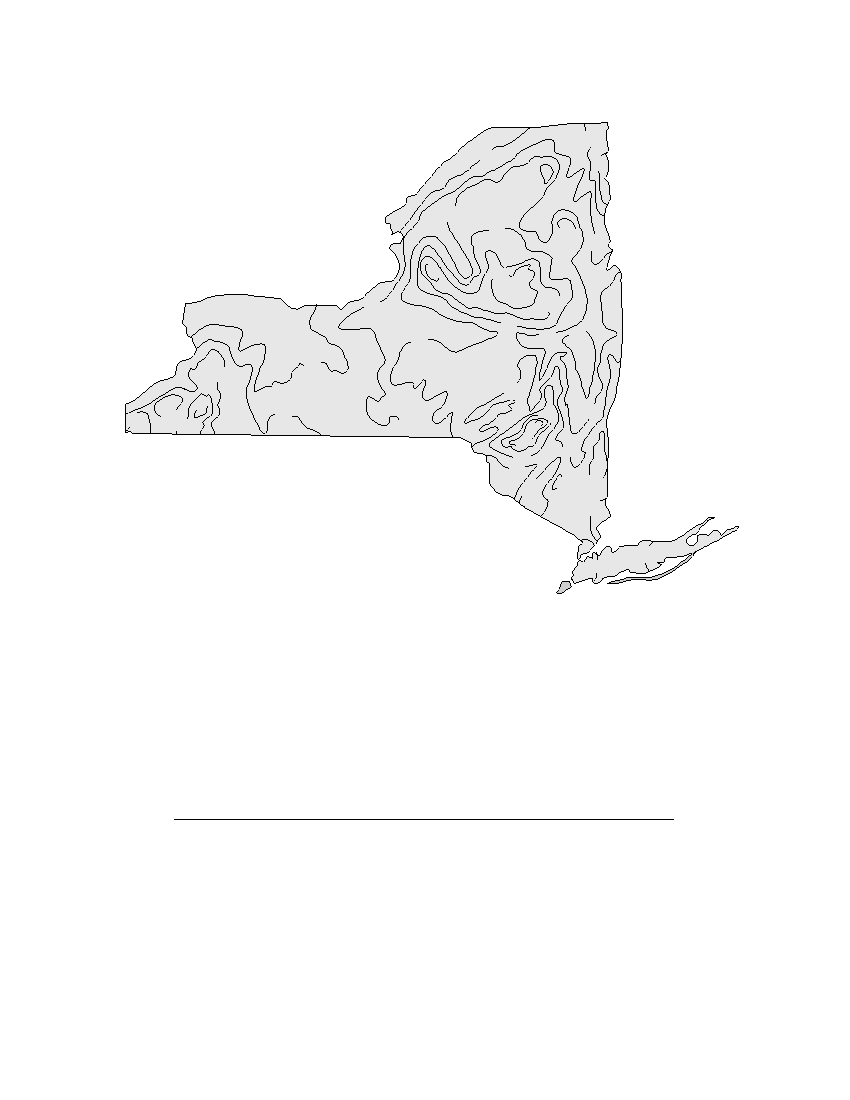
Base your answers to questions 38 and 39 on the isoline map below, which shows the average yearly
precipitation, in inches, across New York State.
32
32
28
40
44
44
36
52
52
36
48
44
40
40
36
40
32
44
4 8
52
40
44
44
36
44
36
60
56
48
44
44
48
48
48
48
44
44
38 Which New York State landscape region receives the greatest average yearly
precipitation?
(1) Catskills
(3) Adirondack Mountains
(2) Tug Hill Plateau
(4) Taconic Mountains
39 Approximately how many inches of average yearly precipitation does Rochester, New
York, receive?
(1) 26
(3) 38
(2) 30
(4) 42
P.S./E. Sci.–August ’07
[10]
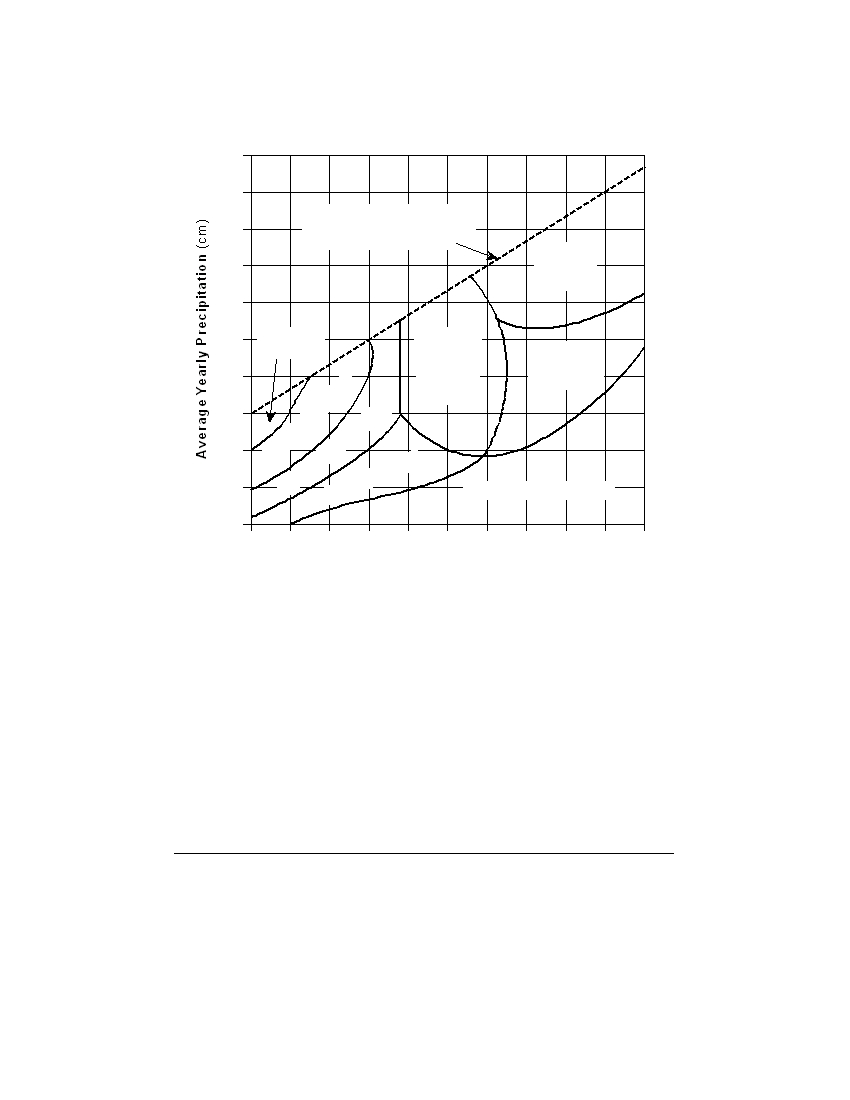
Base your answers to questions 40 and 41 on the graph below, which shows the effect that average yearly
precipitation and temperature have on the type of weathering that will occur in a particular region.
Weathering Determined by Climate
250
225
Approximate limit of possible
200
temperature/precipitation
conditions on Earth
Strong
175
chemical
weathering
150
125
Moderate
Moderate
frost action
chemical
Moderate
weathering
chemical
100
with frost
weathering
action
action
75
frost
action
50
frost
Strong
action
25
Moderate
frost
Very slight weathering
Slight
0
–20
–15
–10
–5
0
5
10
15
20
25
30
Average Yearly Temperature ( ° C)
40 Which type of weathering is most common where the average yearly temperature is
5°C and the average yearly precipitation is 45 cm?
(1) moderate chemical weathering
(2) very slight weathering
(3) moderate chemical weathering with frost action
(4) slight frost action
41 The amount of chemical weathering will increase if
(1) air temperature decreases and precipitation decreases
(2) air temperature decreases and precipitation increases
(3) air temperature increases and precipitation decreases
(4) air temperature increases and precipitation increases
P.S./E. Sci.–August ’07
[11]
[OVER]
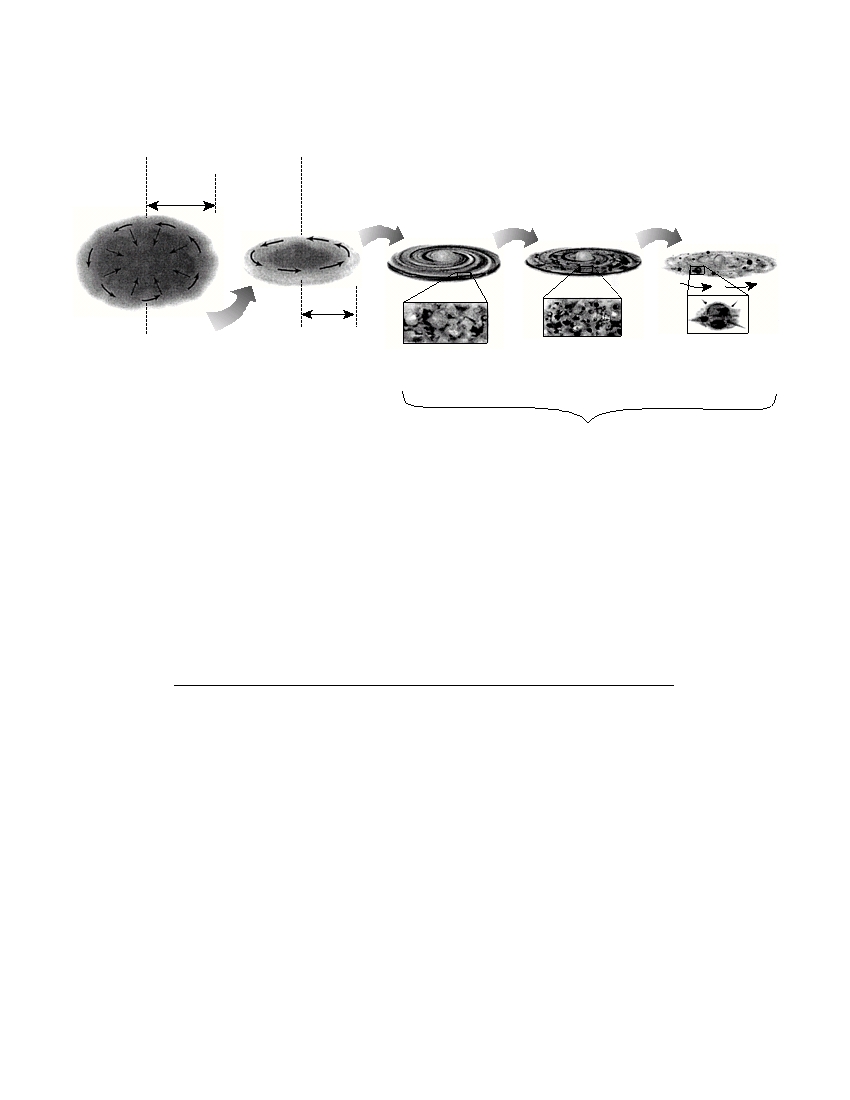
Base your answers to questions 42 and 43 on the diagram below, which shows an inferred sequence in which
our solar system formed from a giant interstellar cloud of gas and debris. Stage A shows the collapse of the gas
cloud, stage B shows its flattening, and stage C shows the sequence that led to the formation of planets.
Axis of rotation
Axis of rotation
Approx
Disk of gas and
10 trillion km
dust spins around
the young Sun.
Approx
15 billion km
Gravity makes
Dust grains
Dust grains
Planetesimals
Slowly spinning
cloud shrink. As it
clump into
collide and
interstellar cloud
shrinks, it spins
faster and flattens
planetesimals.
collect into
into a disk with a
planets.
central bulge.
Stage A
Stage B
Stage C
( Not drawn to scale )
42 From stage B to stage C, the young Sun was created
(1) when gravity caused the center of the cloud to contract
(2) when gravity caused heavy dust particles to split apart
(3) by outgassing from the spinning interstellar cloud
(4) by outgassing from Earth’s interior
43 After the young Sun formed, the disk of gas and dust
(1) became spherical in shape
(3) became larger in diameter
(2) formed a central bulge
(4) eventually formed into planets
P.S./E. Sci.–August ’07
[12]
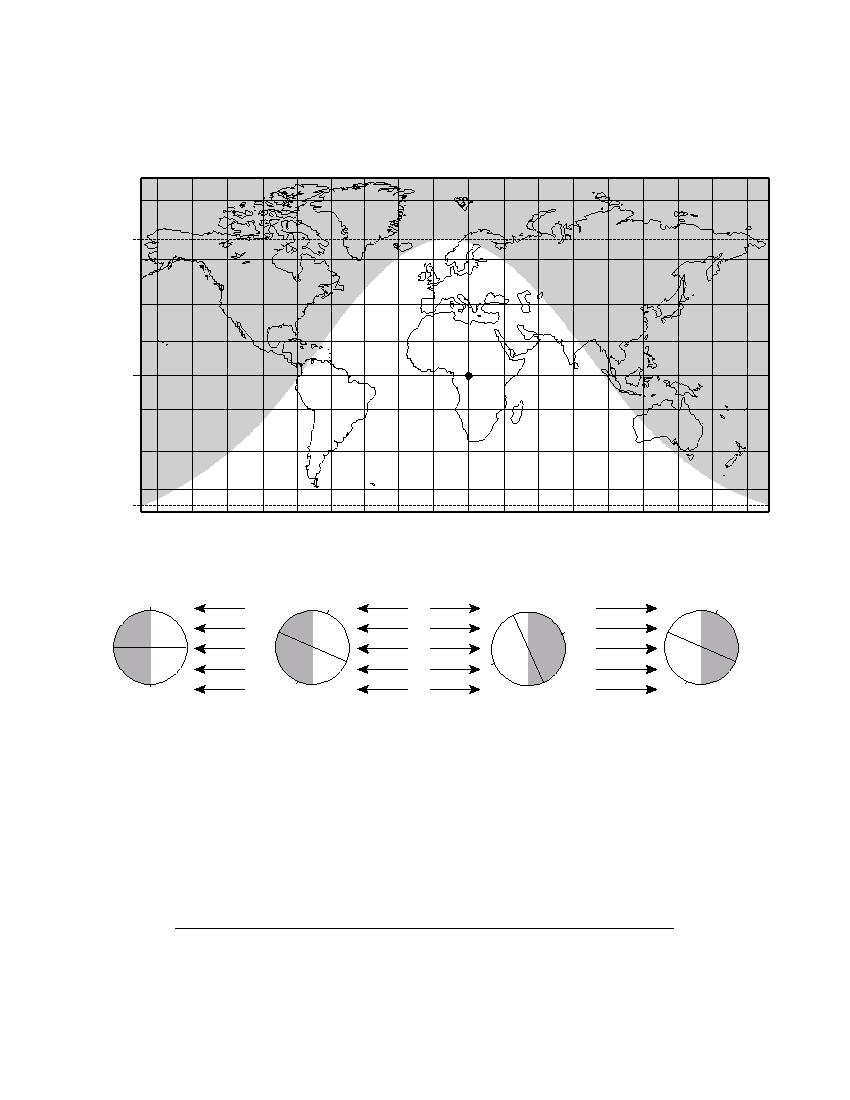
Base your answers to questions 44 through 46 on the world map below. The shaded portion of the map
indicates areas of night, and the unshaded portion indicates areas of daylight on a certain day of the year. Dashed
latitude lines represent the Arctic Circle (66.5° N) and the Antarctic Circle (66.5° S). Point A is a location on
Earth’s surface.
160 ° 140 ° 120 ° 100 °
80 °
60 °
40 °
20 °
0 °
20 °
40 °
60 °
80 ° 100 ° 120 ° 140 ° 160 ° 180 °
66.5 ° N
Equator
A
66.5 ° S
44 Which diagram shows the position of Earth relative to the Sun’s rays on this day?
N
N
N
N
Sun’s
Sun’s
Sun’s
Sun’s
rays
rays
rays
S
rays
S
S
S
( 1 )
( 2 )
( 3 )
( 4 )
45 Approximately how many hours of daylight would occur at position A on this day?
(1) 6
(3) 12
(2) 9
(4) 15
46 On this day, the duration of daylight from the equator to the Arctic Circle
(1) decreases, only
(3) decreases, then increases
(2) increases, only
(4) increases, then decreases
P.S./E. Sci.–August ’07
[13]
[OVER]
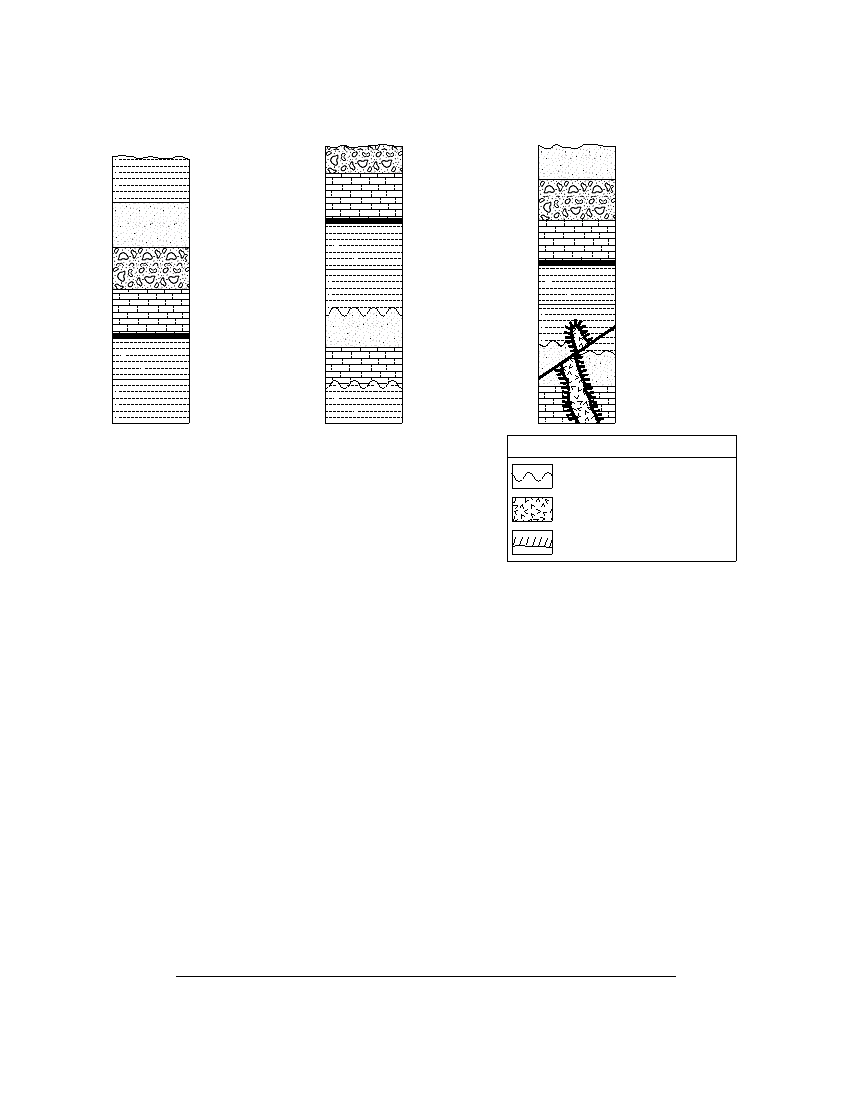
Base your answers to questions 47 through 50 on the cross sections of three rock outcrops, A , B , and C .
Line XY represents a fault. Overturning has not occurred in the rock outcrops.
Outcrop B
Outcrop C
Outcrop A
Conglomerate
Brown sandstone
Tan siltstone
Tan limestone
Conglomerate
Brown
Volcanic ash
sandstone
Green shale
Tan limestone
Conglomerate
Volcanic ash
Gray siltstone
Green shale
Tan limestone
Volcanic ash
Red sandstone
Y
Gray siltstone
Green shale
Gray limestone
Red sandstone
X
Gray siltstone
Black shale
Gray limestone
Key
Unconformity
Igneous intrusion
Contact metamorphism
47 The volcanic ash layer is considered a good time marker for correlating rocks because
the volcanic ash layer
(1) has a dark color
(3) lacks fossils
(2) can be dated using carbon-14
(4) was rapidly deposited over a wide area
48 Which sedimentary rock shown in the outcrops is the youngest?
(1) black shale
(3) tan siltstone
(2) conglomerate
(4) brown sandstone
49 What is the youngest geologic feature in the three bottom layers of outcrop C ?
(1) fault
(3) unconformity
(2) igneous intrusion
(4) zone of contact metamorphism
50 Which processes were primarily responsible for the formation of most of the rock in
outcrop A ?
(1) melting and solidification
(3) compaction and cementation
(2) heating and compression
(4) weathering and erosion
P.S./E. Sci.–August ’07
[14]

Part B–2
Answer all questions in this part.
Directions (51–64): Record your answers in the spaces provided in your answer booklet. Some questions
may require the use of the Earth Science Reference Tables.
Base your answers to questions 51 through 53 on the diagram below, which shows the inferred internal
structure of the four terrestrial planets, drawn to scale.
Venus
Earth
Mercury
Mars
Key
Solid iron core
Silicate mantle
Liquid iron core
Silicate crust
51 How are the crusts of Mars, Mercury, Venus, and Earth similar in composition?
[ 1 ]
52 Identify the two planets that would allow an S -wave from a crustal quake to be
transmitted through the core to the opposite side of the planet.
[ 1 ]
53 Explain why the densities of these terrestrial planets are greater than the densities of
the Jovian planets.
[ 1 ]
P.S./E. Sci.–August ’07
[15]
[OVER]

Base your answers to questions 54 through 56 on the information on the four station models shown below.
The weather data were collected at Niagara Falls, Syracuse, Utica, and New York City at the same time.
Niagara Falls
Syracuse
Utica
New York City
40
201
45
088
60
998
70
012
+10
+09
–12
–01
25
28
58
61
54 What was the air pressure in Niagara Falls?
[ 1 ]
55 Explain how the weather conditions shown on the station models suggest that Utica
had the greatest chance of precipitation.
[ 1 ]
56 New York City was experiencing a wind blowing from the south at 10 knots with hazy
conditions limiting visibility to 43 of a mile. On the station model for New York City
in
your
answer
booklet ,
place,
in
the
proper
location
and
format,
the
information below.
[ 2 ]
P.S./E. Sci.–August ’07
[16]
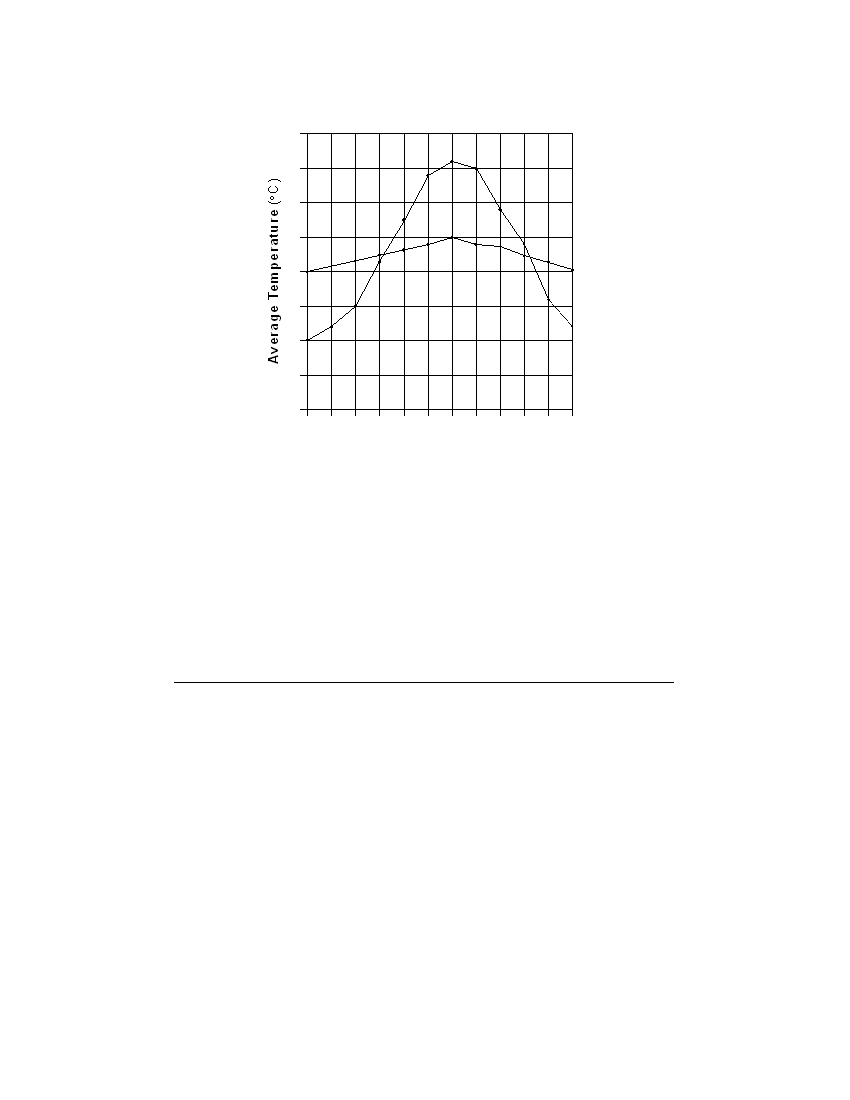
Base your answers to questions 57 through 59 on the graph below, which shows the average monthly
temperatures for a year for city X and city Y . Both cities are located at the same latitude.
30
X
20
Y
10
0
–10
Jan Feb Mar Apr May Jun Jul
Aug Sep Oct Nov Dec
Time (months)
57 What was the range in the average monthly temperatures for city Y during the year?
[ 1 ]
58 Explain why city X has a greater difference between summer and winter
temperatures than city Y .
[ 1 ]
59 What evidence shown on the graph indicates that both cities, X and Y , are located in
the Northern Hemisphere?
[ 1 ]
P.S./E. Sci.–August ’07
[17]
[OVER]
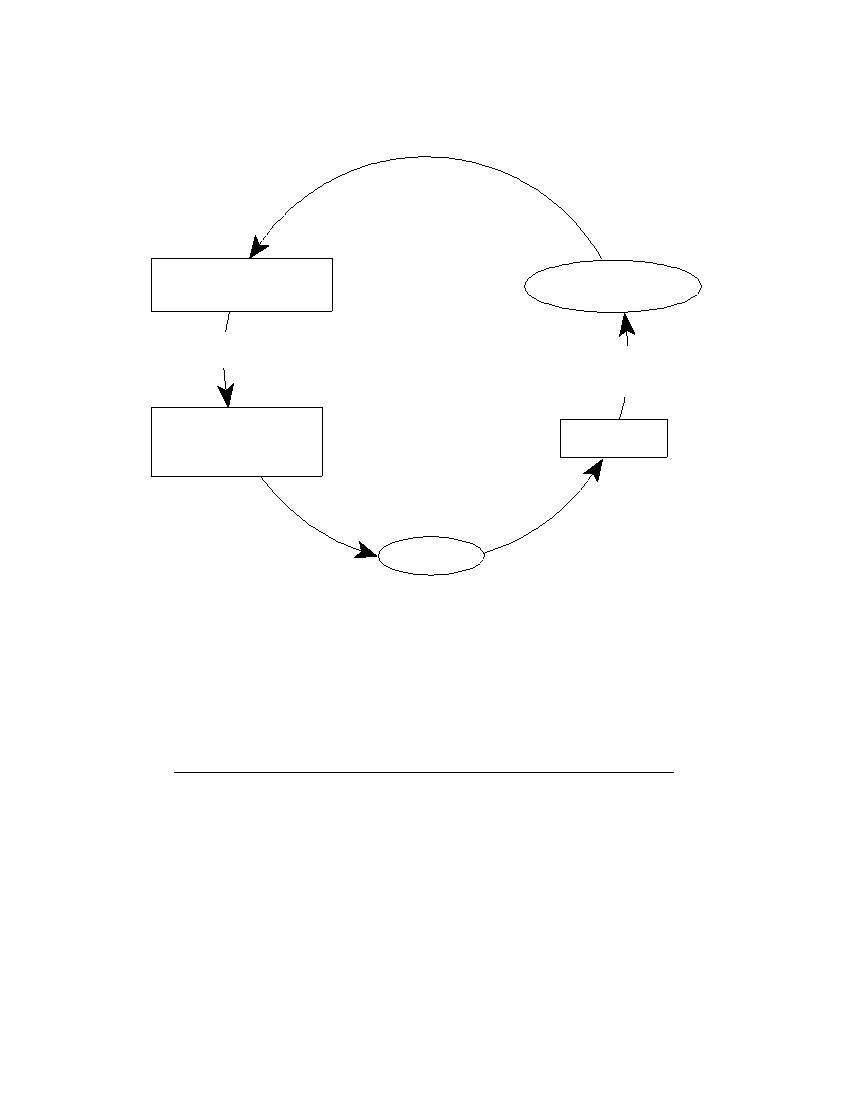
Base your answers to questions 60 through 62 on the diagram below, which represents a part of the rock
cycle. The igneous rock, granite, and the characteristics of sedimentary rock X and metamorphic rock Y are
shown.
Burial
t i o
n
Compaction
D
m
e
n t a
e p
C
e
o s
i t
i o
n
Rock X
Particle diameter size range
Sediments
from 0.1 cm to 0.01 cm
Heat and/or pressure
Metamorphism
Weathering
and Erosion
(Uplift)
Rock Y
Composition: quartz,
Granite
feldspar, mica, amphibole
Banded texture
n
a
t i o
M
e
i f
i c
l t i n
l i d
g
Magma
S o
60 Identify sedimentary rock X .
[ 1 ]
61 Identify metamorphic rock Y .
[ 1 ]
62 Complete the table in your answer booklet, with descriptions of the observable
characteristics used to identify granite. [ 1 ]
P.S./E. Sci.–August ’07
[18]
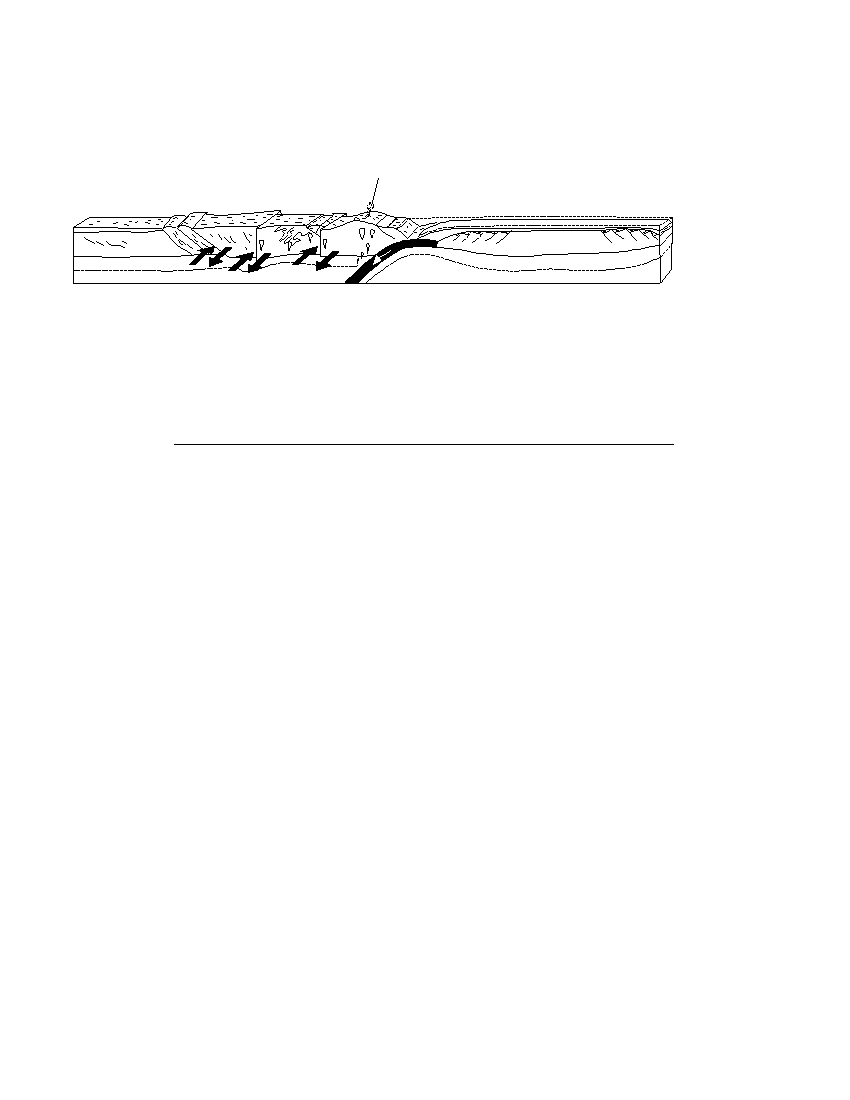
Base your answers to questions 63 and 64 on the block diagram below. The diagram shows the tectonic plate
boundary between Africa and North America 300 million years ago, as these two continents united into a single
landmass. The arrows at letters A, B, C, and D represent relative crustal movements. Letter X shows the
eruption of a volcano at that time.
X
Eastern North American Plate
Western African Plate
300 mya
Late
D
Pennsylvanian
A
B
C
( Not drawn to scale )
63 Identify the type of tectonic plate motion represented by the arrow shown at D .
[ 1 ]
64 Identify the type of tectonic motion represented by the arrows shown at A, B, and C .
[ 1 ]
P.S./E. Sci.–August ’07
[19]
[OVER]

Part C
Answer all questions in this part.
Directions (65–82): Record your answers in the spaces provided in your answer booklet. Some questions
may require the use of the Earth Science Reference Tables.
Base your answers to questions 65 through 67 on the diagram in your answer booklet. The diagram shows
the positions of Halley’s Comet and Asteroid 134340 at various times in their orbits. Specific orbital positions
are shown for certain years.
65 The eccentricity of the asteroid’s orbit is 0.250.
On the orbital diagram in your
answer booklet , mark the position of the second focus of the asteroid’s orbit by
placing an X on the major axis at the proper location.
[ 1 ]
66 Determine which was traveling faster, Halley’s Comet or the asteroid, between the
years 1903 and 1908. State one reason for your choice.
[ 1 ]
67 Explain why Halley’s Comet is considered to be part of our solar system.
[ 1 ]
P.S./E. Sci.–August ’07
[20]
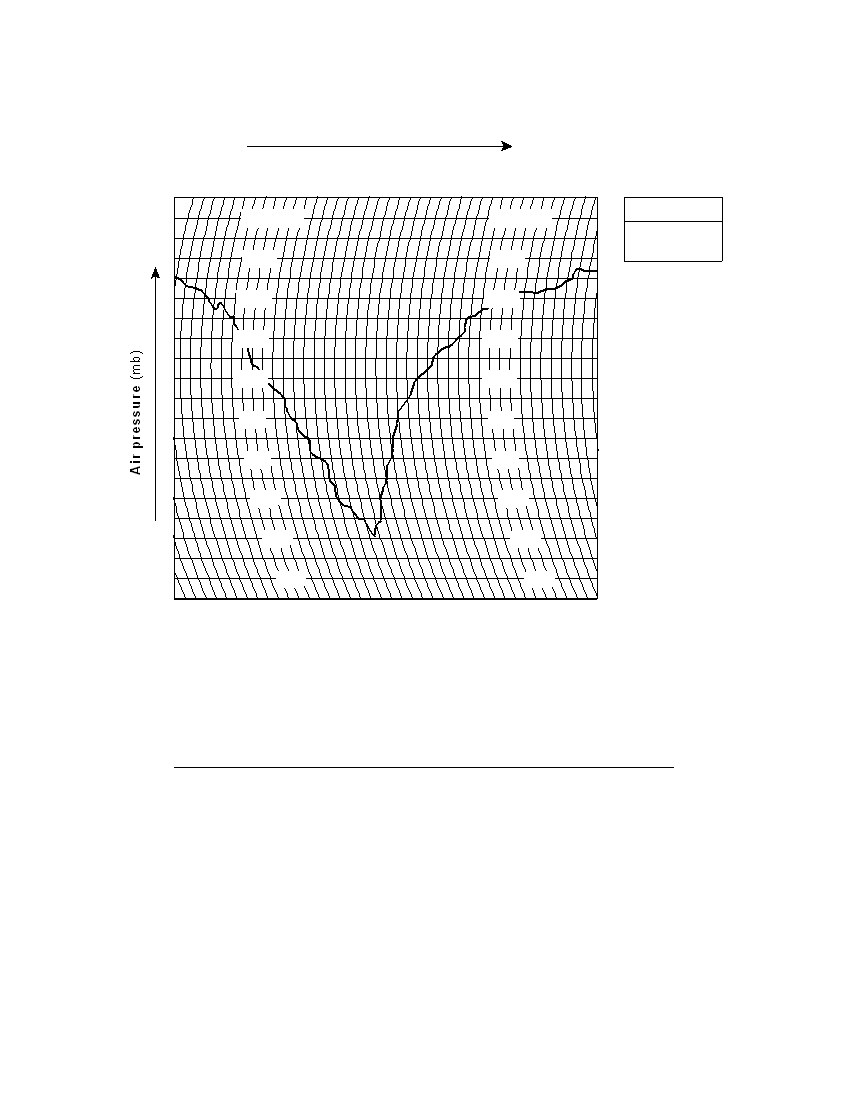
Base your answers to questions 68 and 69 on the barogram below, which shows air pressure recorded in
millibars at Green Bay, Wisconsin, from April 2 through April 4, 1982.
Time
April 2
April 3
April 4
4
8 M 4
8 12 4
8 M 4
8 12 4
8 M 4
8 12 4
8 M
1040 mb
1040 mb
Key
M = Midnight
1030
1030
1020
1020
1010
1010
1000
1000
990
990
980
980
970
970
960
960
950
950
68 Calculate the rate of change in air pressure from 10 a.m. to 8 p.m. on April 3. Label
your answer with the correct units.
[ 2 ]
69 What most likely caused the changes in air pressure for the period of time shown on
the graph?
[ 1 ]
P.S./E. Sci.–August ’07
[21]
[OVER]
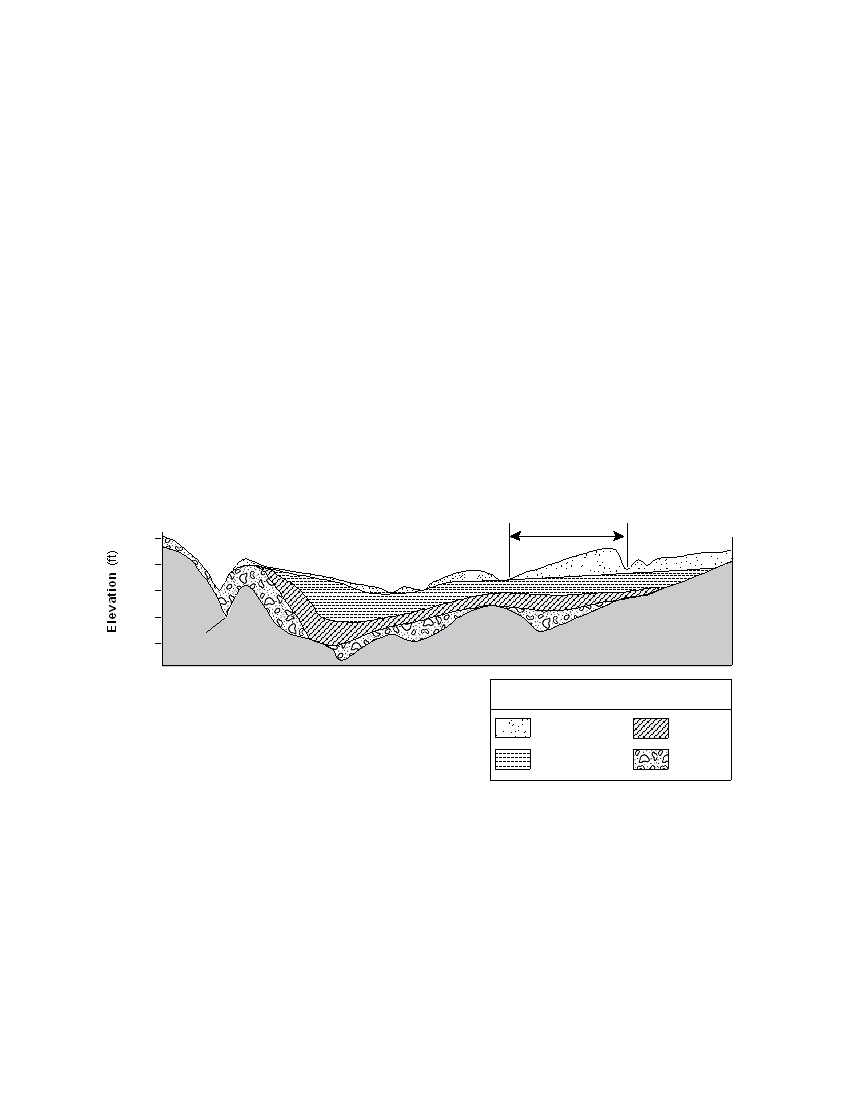
Base your answers to questions 70 through 74 on the passage and the cross section below. The passage
describes the geologic history of the Pine Bush region near Albany, New York. The cross section shows the
bedrock and overlying sediment along a southwest to northeast diagonal line through a portion of this area.
Location A shows an ancient buried stream channel and location B shows a large sand dune.
The Pine Bush Region
The Pine Bush region, just northwest of Albany, New York, is a 40-square mile area
of sand dunes and wetlands covered by pitch pine trees and scrub oak bushes. During
the Ordovician Period, this area was covered by a large sea. Layers of mud and sand
deposited in this sea were compressed into shale and sandstone bedrock.
During most of the Cenozoic Era, running water eroded stream channels into the
bedrock. One of these buried channels is shown at location A in the cross section. Over
the last one million years of the Cenozoic Era, this area was affected by glaciation.
During the last major advance of glacial ice, soil and bedrock were eroded and later
deposited as till (a mixture of boulders, pebbles, sand, and clay).
About 20,000 years ago, the last glacier in New York State began to melt. The
meltwater deposited pebbles and sand, forming the stratified drift. During the 5000
years it took to melt this glacier, the entire Pine Bush area became submerged under
a large 350-foot-deep glacial lake called Lake Albany. Delta deposits of cobbles,
pebbles, and sand formed along the lake shorelines, and beds of silt and clay were
deposited farther into the lake.
Lake Albany drained about 12,000 years ago, exposing the lake bottom. Wind
erosion created the sand dunes that cover much of the Pine Bush area today.
SW
NE
400
B
S
S
S
200
Sea
A
level
Bedrock
Key
(Types of Sediment)
S
Wind-blown
Stratified
sand
drift
Clay and silt
Till
70 According to the passage, how old is the bedrock shown in the cross section?
[ 1 ]
71 What evidence shown at location A suggests that the channel in the bedrock was
eroded by running water?
[ 1 ]
P.S./E. Sci.–August ’07
[22]

72 List, from oldest to youngest, the four types of sediment shown above the bedrock in
the cross section.
[ 1 ]
73 Explain why the till layer is composed of unsorted sediment.
[ 1 ]
74 How does the shape of the sand dune at location B provide evidence that the
prevailing winds that formed this dune were blowing from the southwest?
[ 1 ]
Base your answers to questions 75 through 77 on the data table below. A student recorded the hours of
daylight and the altitude of the Sun at noon on the twenty-first day of every month for one year in Buffalo, New
York.
Data Table
Hours of
Altitude of the
Date
Daylight
Sun at Noon ( ° )
January 21
9.5
32.3
February 21
10.8
40.1
March 21
12.0
47.3
April 21
13.7
55.1
May 21
14.8
62.5
June 21
15.3
70.4
July 21
14.8
63.3
August 21
13.7
55.5
September 21
12.1
47.7
October 21
10.8
39.9
November 21
9.5
32.1
December 21
9.0
24.4
75 On the graph in your answer booklet , draw a line to represent the general relation-
ship between the altitude of the Sun at noon and the number of hours of daylight
throughout the year at Buffalo.
[ 1 ]
76 The sky model diagram in your answer booklet shows the apparent path of the Sun
on March 21 for an observer in Buffalo, New York.
Draw a line to represent the
apparent path of the Sun from sunrise to sunset at Buffalo on May 21. Be sure your
path indicates the correct altitude of the noon Sun and begins and ends at the correct
positions on the horizon.
[ 2 ]
77 On the same sky model diagram in your answer booklet , place an asterisk ( ! ) at the
apparent position of the North Star as seen from Buffalo.
[ 1 ]
P.S./E. Sci.–August ’07
[23]
[OVER]

Base your answers to questions 78 through 80 on the field map in your answer booklet, which shows an area
of a state park where an underground gasoline tank leaked and contaminated the groundwater. Groundwater-
monitoring wells were installed to determine the extent of the contamination.
The concentration of
contaminants in parts per million (ppm) in each of the wells is indicated on the map.
78 On the field map in your answer booklet , draw the 50-ppm, 100-ppm, and 150-ppm
isolines. The 0-ppm isoline has been drawn for you.
[ 1 ]
79 State the relationship between the distance from the gasoline tank and the
concentration of contaminants in the groundwater.
[ 1 ]
80 Park officials do not want to see another incident of groundwater contamination from
gasoline tanks. State one action that park officials could take to prevent gasoline from
contaminating the groundwater in the future.
[ 1 ]
Base your answers to questions 81 and 82 on the hardness of the minerals talc, quartz, halite, sulfur, and fluorite.
81 On the grid in your answer booklet , construct a bar graph to represent the hardness
of these minerals.
[ 1 ]
82 Which mineral shown on the grid would be the best abrasive? State one reason for
your choice.
[ 1 ]
P.S./E. Sci.–August ’07
[24]


The University of the State of New York
R EGENTS H IGH S CHOOL E XAMINATION
PHYSICAL SETTING
EARTH SCIENCE
Thursday, August 16, 2007 — 12:30 to 3:30 p.m., only
ANSWER SHEET
Student . . . . . . . . . . . . . . . . . . . . . . . . . . . . . . . . . . . . . . . . . . . . . . .
Sex:
! Male
! Female
Grade . . . . . . . . . . . .
Teacher . . . . . . . . . . . . . . . . . . . . . . . . . . . . . . . . . . . . . . . . . . . . . . .
School
. . . . . . . . . . . . . . . . . . . . . . . . . . . . . . . . . . . .
Record your answers to Part A and Part B–1 on this answer sheet.
Part A
Part B–1
1 . . . . . . . . . . . .
13 . . . . . . . . . . . .
25 . . . . . . . . . . .
36 . . . . . . . . . . . .
44 . . . . . . . . . . . .
2 . . . . . . . . . . . .
14 . . . . . . . . . . . .
26 . . . . . . . . . . .
37 . . . . . . . . . . . .
45 . . . . . . . . . . . .
3 . . . . . . . . . . . .
15 . . . . . . . . . . . .
27 . . . . . . . . . . .
38 . . . . . . . . . . . .
46 . . . . . . . . . . . .
4 . . . . . . . . . . . .
16 . . . . . . . . . . . .
28 . . . . . . . . . . .
39 . . . . . . . . . . . .
47 . . . . . . . . . . . .
5 . . . . . . . . . . . .
17 . . . . . . . . . . . .
29 . . . . . . . . . . .
40 . . . . . . . . . . . .
48 . . . . . . . . . . . .
6 . . . . . . . . . . . .
18 . . . . . . . . . . . .
30 . . . . . . . . . . .
41 . . . . . . . . . . . .
49 . . . . . . . . . . . .
7 . . . . . . . . . . . .
19 . . . . . . . . . . . .
31 . . . . . . . . . . .
42 . . . . . . . . . . . .
50 . . . . . . . . . . . .
Part B–1 Score
8 . . . . . . . . . . . .
20 . . . . . . . . . . . .
32 . . . . . . . . . . .
43 . . . . . . . . . . . .
9 . . . . . . . . . . . .
21 . . . . . . . . . . . .
33 . . . . . . . . . . .
10 . . . . . . . . . . . .
22 . . . . . . . . . . . .
34 . . . . . . . . . . .
11 . . . . . . . . . . . .
23 . . . . . . . . . . . .
35 . . . . . . . . . . .
Part A Score
12 . . . . . . . . . . . .
24 . . . . . . . . . . . .
Write your answers to Part B–2 and Part C in your answer booklet.
The declaration below should be signed when you have completed the examination.
I do hereby affirm, at the close of this examination, that I had no unlawful knowledge of the questions or answers prior to
the examination and that I have neither given nor received assistance in answering any of the questions during the examination.
Signature

PS/EARTH SCIENCE
E C N E I C S H T R A E / S P