
PS/EARTH SCIENCE
The University of the State of New York
REGENTS HIGH SCHOOL EXAMINATION
PHYSICAL SETTING
EARTH SCIENCE
Friday, June 20, 2008 — 1:15 to 4:15 p.m., only
This is a test of your knowledge of Earth science. Use that knowledge to answer
all questions in this examination. Some questions may require the use of the Earth
Science Reference Tables. The Earth Science Reference Tables are supplied separately.
Be certain you have a copy of the 2001 Edition (Revised November 2006) of these
reference tables before you begin the examination.
Your answer sheet for Part A and Part B–1 is the last page of this examination
booklet. Turn to the last page and fold it along the perforations. Then, slowly and
carefully, tear off your answer sheet and fill in the heading.
The answers to the questions in Part B–2 and Part C are to be written in your
separate answer booklet. Be sure to fill in the heading on the front of your answer
booklet.
You are to answer all questions in all parts of this examination according to the
directions provided in the examination booklet. Record your answers to the Part A
and Part B–1 multiple-choice questions on your separate answer sheet. Write your
answers to the Part B–2 and Part C questions in your answer booklet. All work should
be written in pen, except for graphs and drawings, which should be done in pencil.
You may use scrap paper to work out the answers to the questions, but be sure to
record all your answers on your separate answer sheet and in your answer booklet.
When you have completed the examination, you must sign the statement printed
at the end of your separate answer sheet, indicating that you had no unlawful
knowledge of the questions or answers prior to the examination and that you have
neither given nor received assistance in answering any of the questions during the
examination. Your answer sheet and answer booklet cannot be accepted if you fail to
sign this declaration.
Notice. . .
A four-function or scientific calculator and a copy of the 2001 Earth Science Reference Tables
(Revised November 2006) must be available for you to use while taking this examination.
The use of any communications device is strictly prohibited when taking this
examination. If you use any communications device, no matter how briefly, your
examination will be invalidated and no score will be calculated for you.
DO NOT OPEN THIS EXAMINATION BOOKLET UNTIL THE SIGNAL IS GIVEN.
E C N E I C S H T R A E / S P
Part A
Answer all questions in this part.
Directions (1–35): For each statement or question, write on your separate answer sheet the number of the
word or expression that, of those given, best completes the statement or answers the question. Some questions
may require the use of the Earth Science Reference Tables .
1 As viewed from Earth, most stars appear to move
5 The Coriolis effect provides evidence that Earth
across the sky each night because
(1) rotates on its axis
(1) Earth revolves around the Sun
(2) revolves around the Sun
(2) Earth rotates on its axis
(3) undergoes cyclic tidal changes
(3) stars orbit around Earth
(4) has a slightly eccentric orbit
(4) stars revolve around the center of the galaxy
6 The altitude of the ozone layer near the South
2 The star Algol is estimated to have approximately
Pole is 20 kilometers above sea level. Which
the same luminosity as the star Aldebaran and
temperature zone of the atmosphere contains this
approximately the same temperature as the star
ozone layer?
Rigel. Algol is best classified as a
(1) troposphere
(3) mesosphere
(1) main sequence star
(3) white dwarf star
(2) stratosphere
(4) thermosphere
(2) red giant star
(4) red dwarf star
7 A low-pressure system in the Northern
3 The explosion associated with the Big Bang
Hemisphere has a surface air-circulation pattern
theory and the formation of the universe is
that is
inferred to have occurred how many billion years
(1) clockwise and away from the center
ago?
(2) clockwise and toward the center
(1) less than 1
(3) 4.6
(3) counterclockwise and away from the center
(2) 2.5
(4) over 10
(4) counterclockwise and toward the center
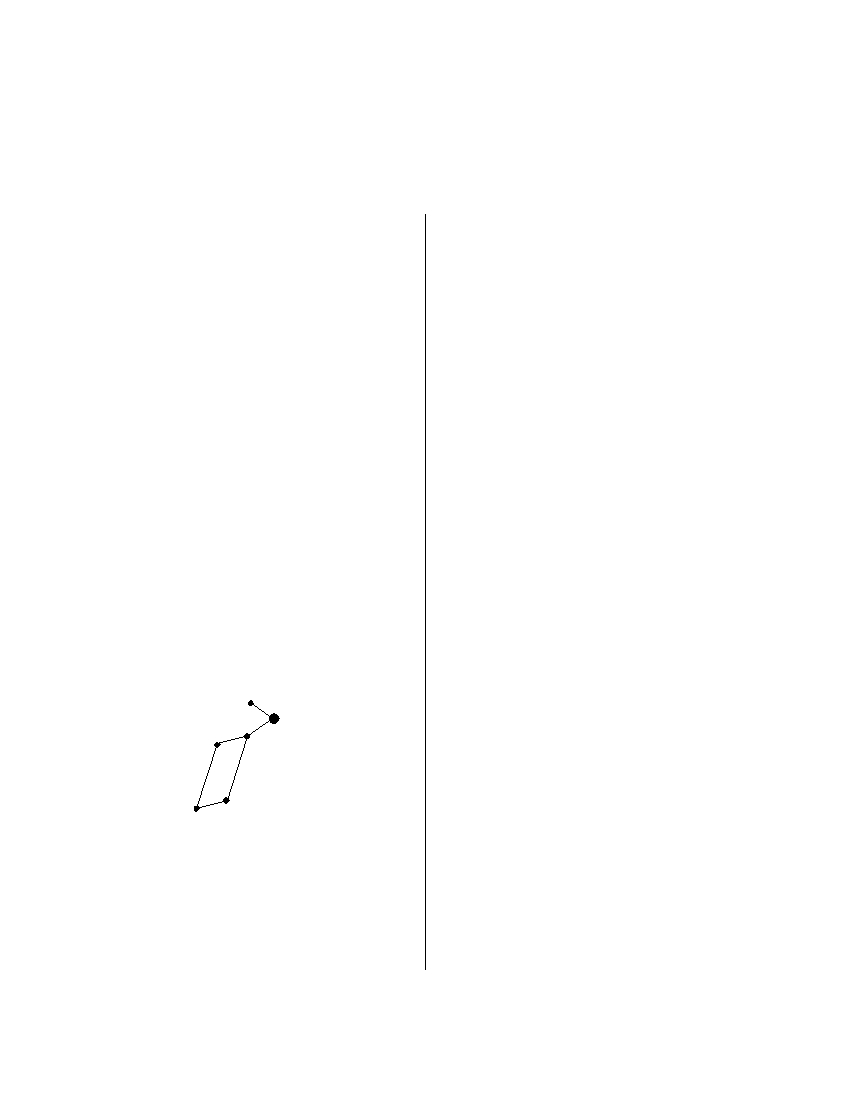
4 The diagram below represents the constellation
8 Air masses are identified on the basis of tempera-
Lyra.
ture and
(1) type of precipitation
Lyra
(2) wind velocity
(3) moisture content
(4) atmospheric transparency
9 During some winters in the Finger Lakes region
of New York State, the lake water remains
unfrozen even though the land around the lakes
Which statement best explains why Lyra is visible
is frozen and covered with snow. The primary
to an observer in New York State at midnight in
cause of this difference is that water
July but not visible at midnight in December?
(1) gains heat during evaporation
(1) Earth spins on its axis.
(2) is at a lower elevation
(2) Earth orbits the Sun.
(3) has a higher specific heat
(3) Lyra spins on its axis.
(4) reflects more radiation
(4) Lyra orbits Earth.
P.S./E. Sci.–June ’08
[2]

10 The reaction below represents an energy-producing process.
Hydrogen
+
Hydrogen
→
Helium
+
Energy
(lighter element)
(lighter element)
(heavier element)
The reaction represents how energy is produced
(1) in the Sun by fusion
(2) when water condenses in Earth’s atmosphere
(3) from the movement of crustal plates
(4) during nuclear decay
11 The diagram below shows the spectral lines for an element.
Violet
Red
Which diagram best represents the spectral lines of this element when its light is
observed coming from a star that is moving away from Earth?
Violet
Red
( 1 )
Violet
Red
( 2 )
Violet
Red
( 3 )
Violet
Red
( 4 )
P.S./E. Sci.–June ’08
[3]
[OVER]
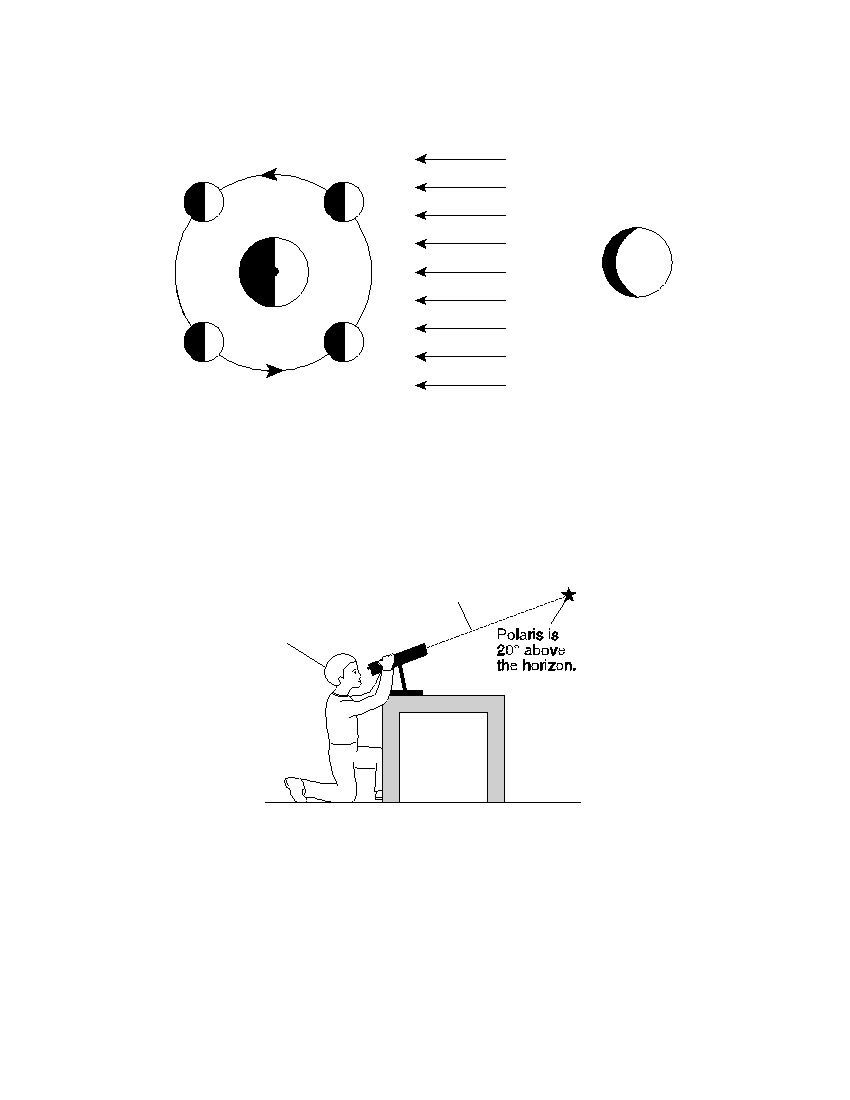
12 Diagram 1 shows the Moon in its orbit at four positions labeled A, B, C, and D. Diagram 2 shows a phase
of the Moon as viewed from New York State.
Diagram 1
B
A
Diagram 2
North
Sun’s
Pole
rays
Earth
C
D
(Not drawn to scale)
At which labeled Moon position would the phase of the Moon shown in diagram 2 be
observed from New York State?
(1) A
(3) C
(2) B
(4) D
13 The diagram below shows an observer measuring the altitude of Polaris.
Line of sight
Observer
(Not drawn to scale)
What is the latitude of the observer?
(1) 20° N
(3) 70° N
(2) 20° S
(4) 70° S
P.S./E. Sci.–June ’08
[4]
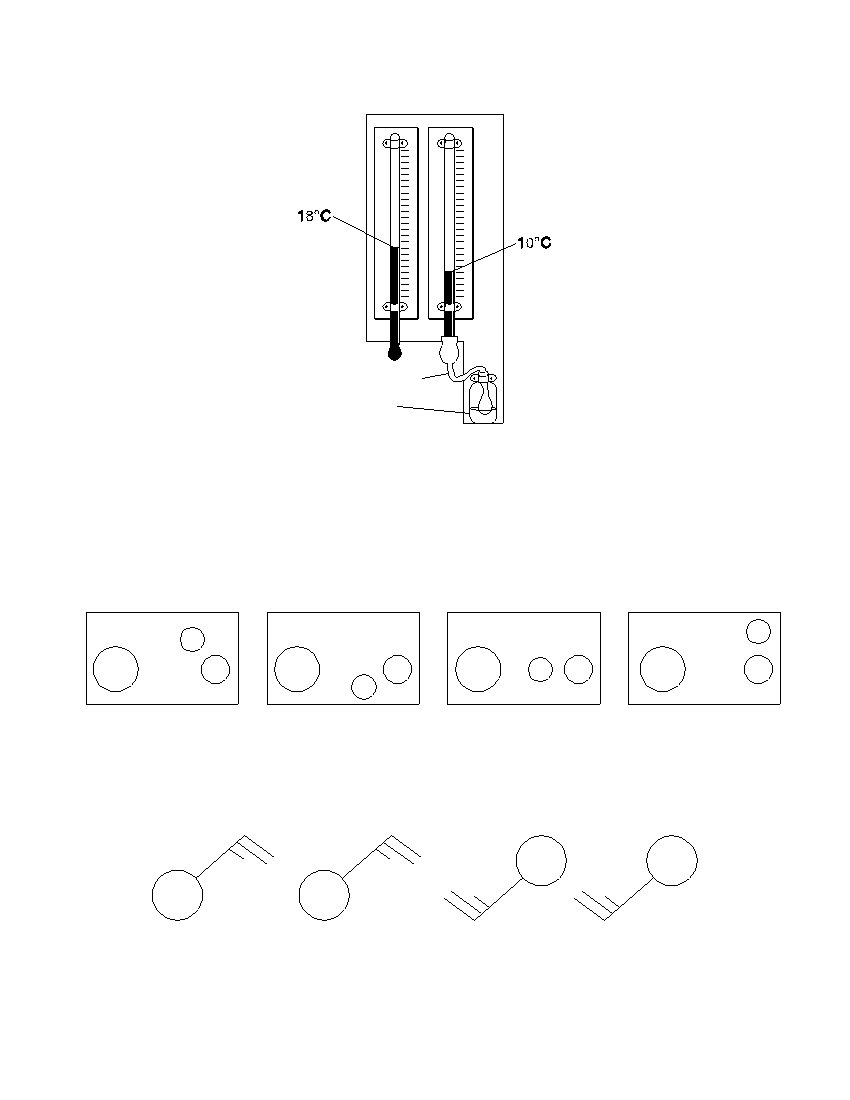
14 The weather instrument shown below can be used to determine dewpoint.
Wet cloth wick
Reservoir
of water
Based on the values shown, the dewpoint is
(1) – 5°C
(3) 8°C
(2) 2°C
(4) 33°C
15 Which arrangement of the Sun, the Moon, and Earth results in the highest high tides, and the lowest low
tides on Earth? (Diagrams are not drawn to scale.)
M
M
S
E
S
E
S
M
E
S
E
M
( 1 )
( 2 )
( 3 )
( 4 )
16 Which station model correctly represents the weather conditions in an area that is experiencing winds from
the northeast at 25 knots and has had a steady drop in barometric pressure of 2.7 millibars during the last
three hours?
–27 \
–27 \
–27 \
–27 \
( 1 )
( 2 )
( 3 )
( 4 )
P.S./E. Sci.–June ’08
[5]
[OVER]
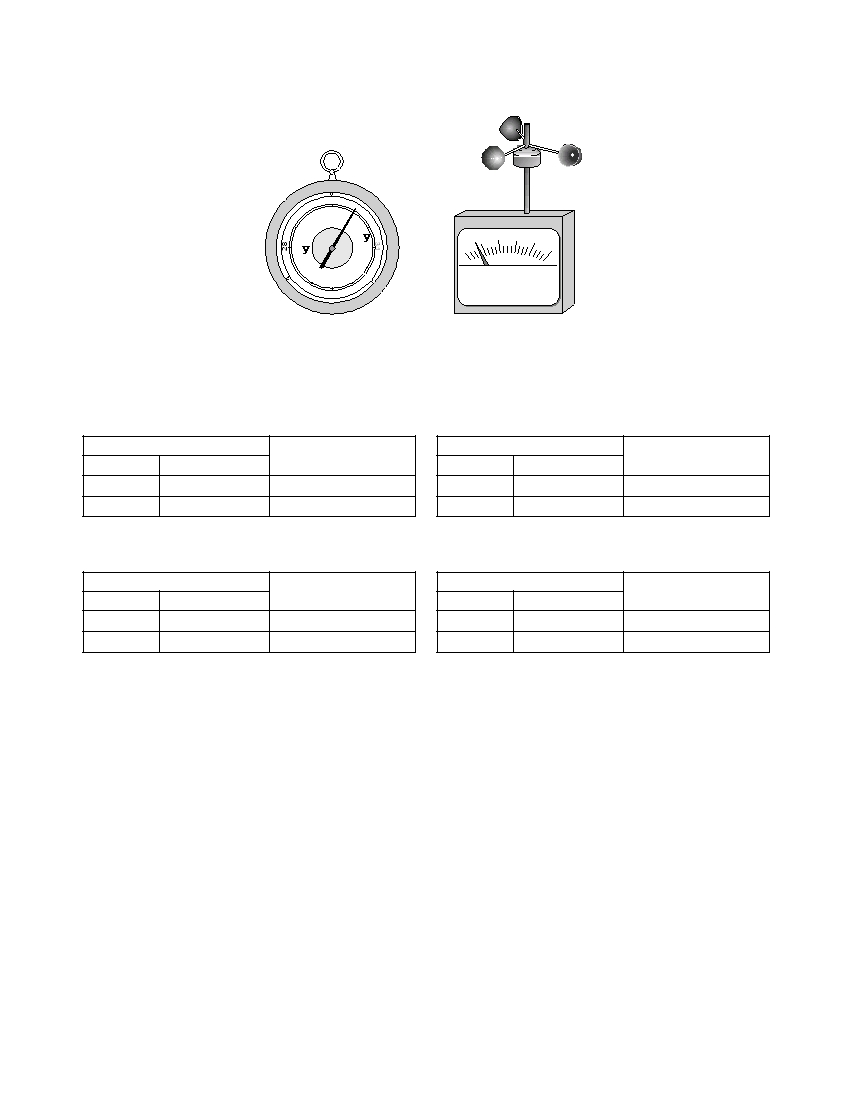
17 The diagram below shows weather instruments A and B .
29
30
C h an g e
n
V
R
a
i
e
r
20
40
60
80
m
100
r
0
o
r
D
t
S
y
27
26
A
B
Which table correctly indicates the name of the weather instrument and the weather
variable that it measures?
Instrument
Weather Variable
Instrument
Weather Variable
Letter
Name
Measured
Letter
Name
Measured
A
thermometer
humidity
A
barometer
wind speed
B
wind vane
wind direction
B
anemometer
air pressure
( 1 )
( 3 )
Instrument
Weather Variable
Instrument
Weather Variable
Letter
Name
Measured
Letter
Name
Measured
A
thermometer
wind direction
A
barometer
air pressure
B
wind vane
humidity
B
anemometer
wind speed
( 2 )
( 4 )
18 Which ocean current carries cool water toward Earth’s equator?
(1) Alaska Current
(3) Peru Current
(2) East Australia Current
(4) North Atlantic Current
19 Equal areas of which surface would most likely absorb the most insolation?
(1) smooth, white surface
(3) smooth, black surface
(2) rough, white surface
(4) rough, black surface
P.S./E. Sci.–June ’08
[6]
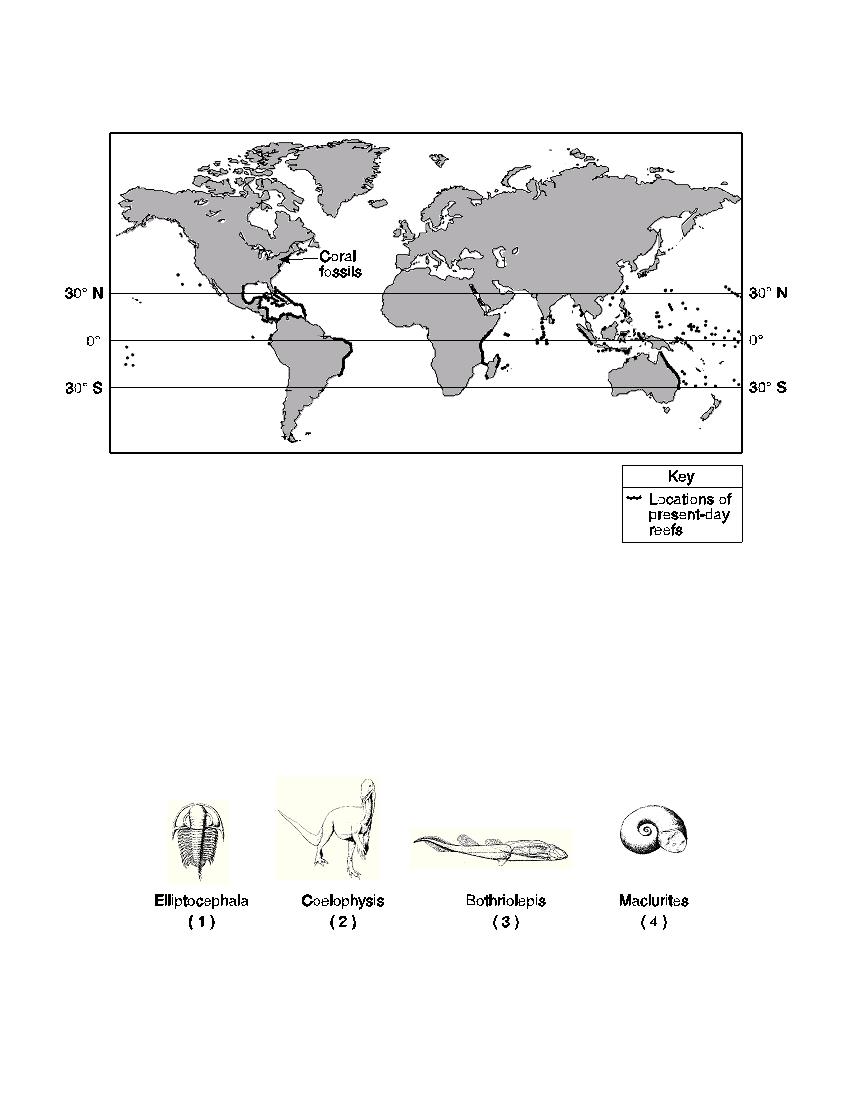
20 On the map below, the darkened areas represent locations where living corals currently exist. The arrow
points to a location where coral fossils have been found in Devonian-age bedrock in New York State.
Devonian-age coral fossils found in some New York State bedrock are not located in
the same general region that present-day corals are living because during the
Devonian Period
(1) corals migrated to New York State
(2) corals lived everywhere on Earth
(3) New York State was closer to the equator
(4) New York State had a colder climate
21 Which index fossil may be found in the surface bedrock near Ithaca, New York?
P.S./E. Sci.–June ’08
[7]
[OVER]
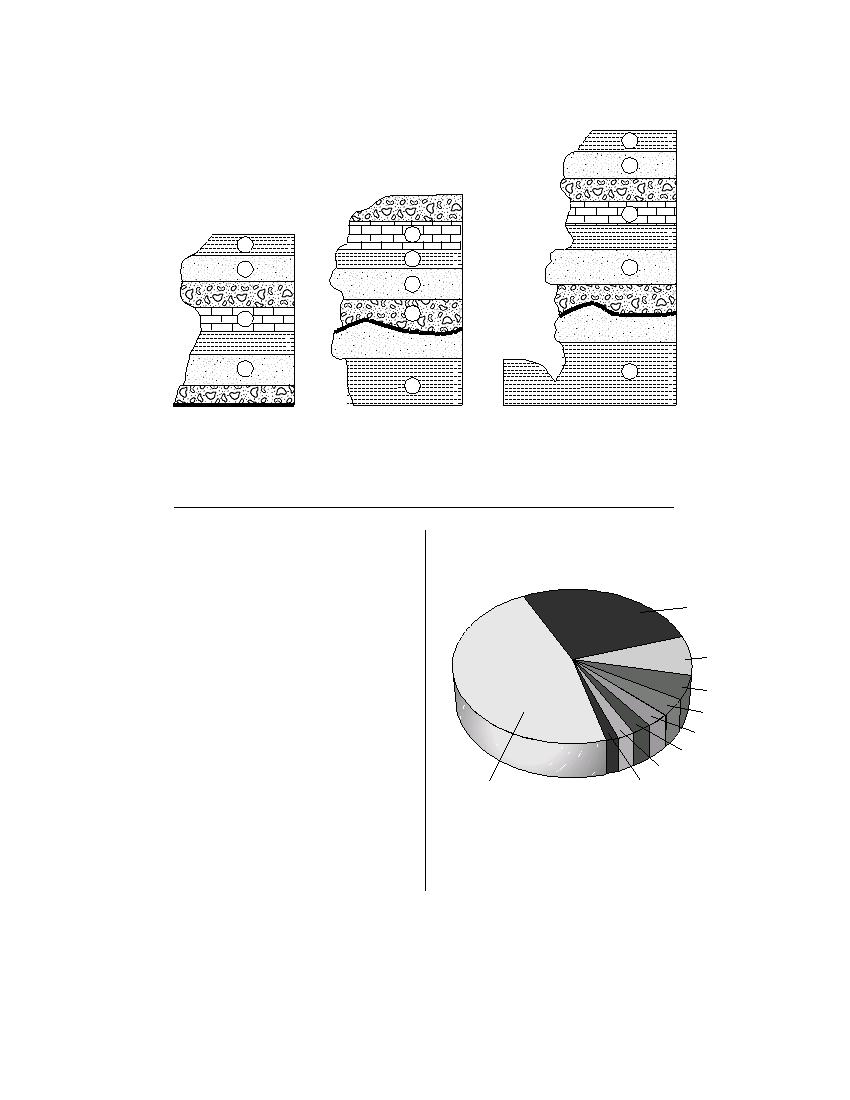
22 The cross sections below represent three widely separated outcrops of exposed bedrock. Letters A, B, C,
and D represent fossils found in the rock layers.
A
B
C
A
A
A
B
D
B
D
A
D
A
A
Which fossil appears to have the best characteristics of an index fossil?
(1) A
(3) C
(2) B
(4) D
23 Active volcanoes are most abundant along the
26 The pie graph below shows the elements com-
(1) edges of tectonic plates
prising Earth’s crust in percent by mass.
(2) eastern coastline of continents
(3) 23.5° N and 23.5° S parallels of latitude
X
(4) equatorial ocean floor
24 Which part of Earth’s interior is inferred to have
Aluminum
convection currents that cause tectonic plates to
move?
Iron
(1) rigid mantle
(3) outer core
Calcium
(2) asthenosphere
(4) inner core
Sodium
Magnesium
Potassium
25 Compared to the continental crust, the oceanic
Oxygen
Other
crust is
(1) less dense and less felsic
Which element is represented by the letter X ?
(2) less dense and less mafic
(1) silicon
(3) nitrogen
(3) more dense and more felsic
(2) lead
(4) hydrogen
(4) more dense and more mafic
P.S./E. Sci.–June ’08
[8]
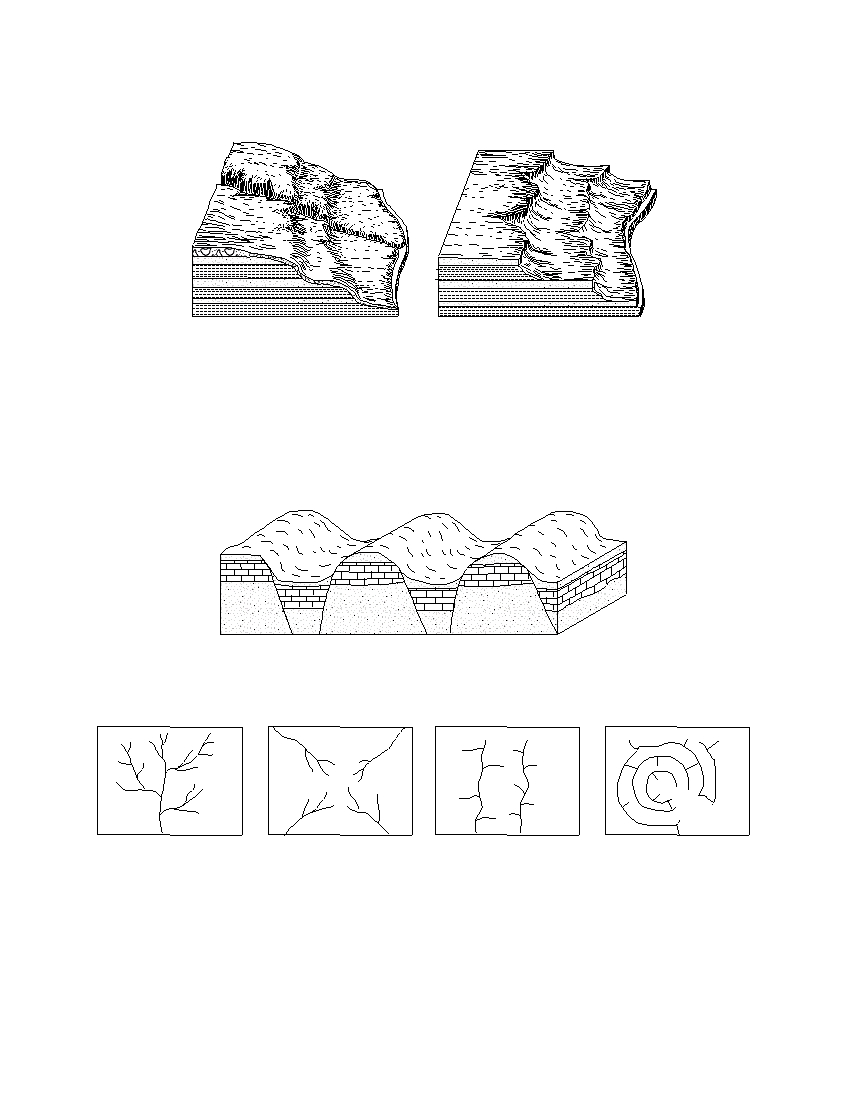
27 The block diagrams below show two landscape regions labeled A and B .
A
B
What is the most probable cause of the difference in surface features between A and B ?
(1) A is the result of a humid climate, while B is the result of a dry climate.
(2) A is at a high elevation, while B is located at sea level.
(3) A is a plateau region, while B is a mountainous region.
(4) A is composed of igneous bedrock, while B is composed of sedimentary bedrock.
28 The block diagram below shows a region that has undergone faulting.
Which map shows the stream drainage pattern that would most likely develop on the
surface of this region?
( 1 )
( 2 )
( 3 )
( 4 )
P.S./E. Sci.–June ’08
[9]
[OVER]
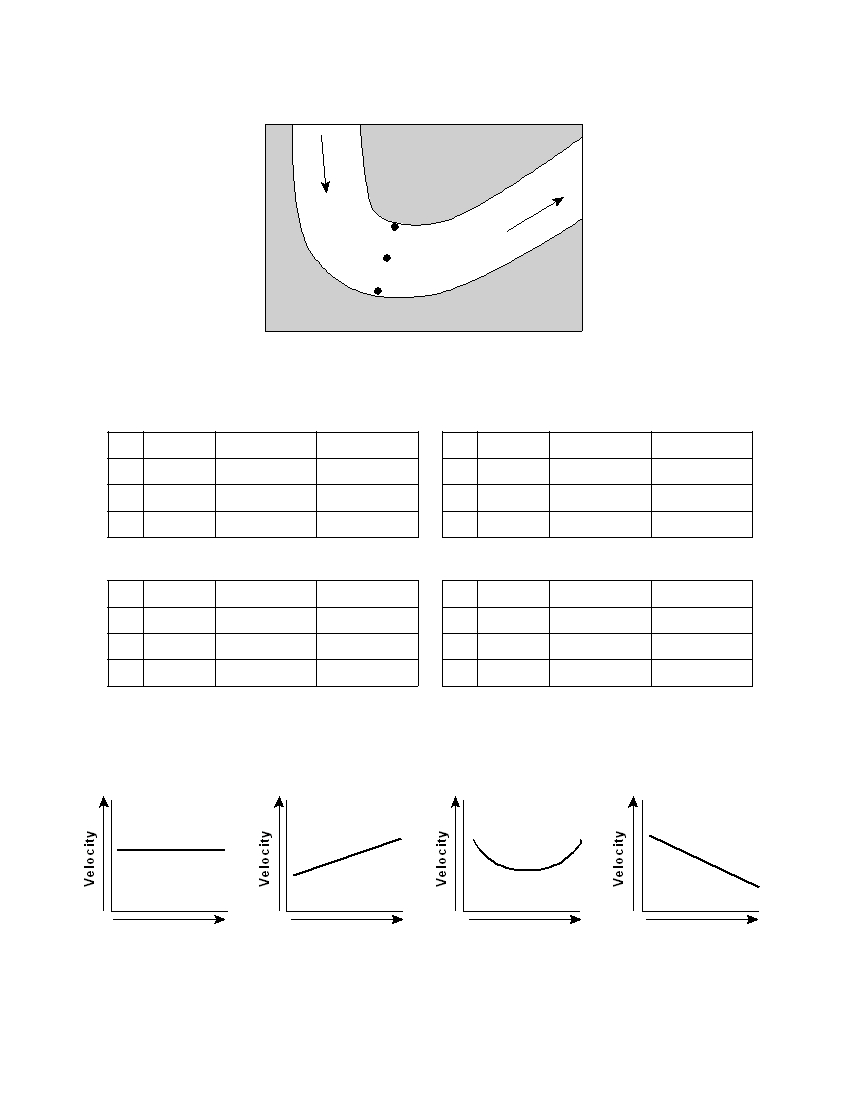
29 The map below shows the bend of a large meandering stream. The arrows show the direction of stream flow.
Letters A, B, and C are positions on the streambed where erosion and deposition data were collected.
A
B
C
Which table best represents the locations where erosion and deposition are dominant
and where an equilibrium exists between the two processes? [A check mark ( ✓ )
represents the dominant process for each lettered location.]
Erosion Equilibrium
Deposition
Erosion Equilibrium
Deposition
A
✓
A
✓
B
✓
B
✓
C
✓
C
✓
( 1 )
( 3 )
Erosion Equilibrium
Deposition
Erosion Equilibrium
Deposition
A
✓
A
✓
B
✓
B
✓
C
✓
C
✓
( 2 )
( 4 )
30 Which graph best represents the relationship between the discharge of a stream and the velocity of stream
flow?
Discharge
Discharge
Discharge
Discharge
( 1 )
( 2 )
( 3 )
( 4 )
P.S./E. Sci.–June ’08
[10]
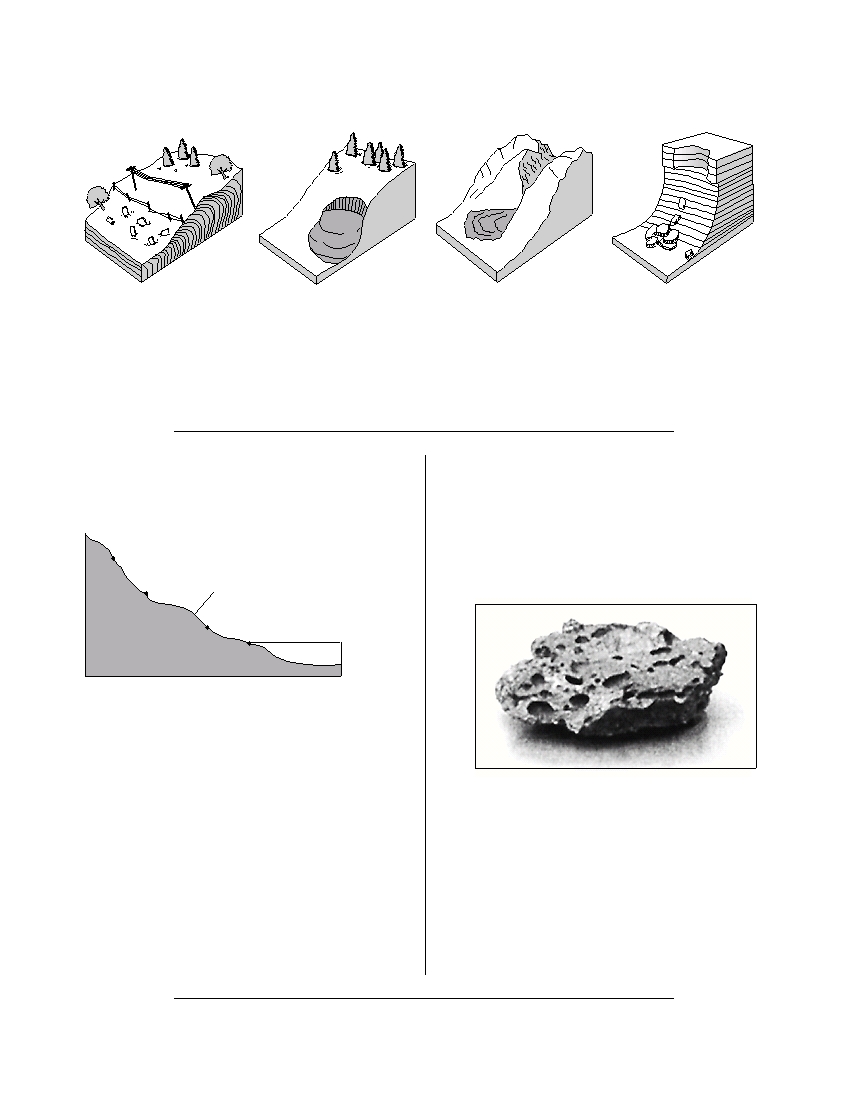
31 The diagrams below represent four different examples of one process that transports sediments.
Soil creep
Debris flow
Mud flow
Rock fall
Gradual downhill
Rapid downslope flow
Downward flow of fine
Rapid falling of pieces
movement of soil
of debris
particles (mud) and
of rock from a cliff or
large amounts of water
steep slope
Which process is shown in these diagrams?
(1) chemical weathering
(3) mass movement
(2) wind action
(4) rock abrasion
32 The cross section below shows a stream flowing
34 Which rock is sedimentary in origin and formed
downhill. Points A through D are locations in the
as a result of chemical processes?
stream.
(1) granite
(3) breccia
(2) shale
(4) dolostone
A
35 The photograph below shows an igneous rock.
B
Stream
C
D
Lake
At which point would most deposition occur?
(1) A
(3) C
(2) B
(4) D
33 A stream flowing at a velocity of 250 centimeters
What is the origin and rate of formation of this
per second is transporting sediment particles
rock?
ranging in size from clay to cobbles. Which trans-
ported particles will be deposited by the stream if
(1) plutonic with slow cooling
its velocity decreases to 100 centimeters per
(2) plutonic with rapid cooling
second?
(3) volcanic with slow cooling
(4) volcanic with rapid cooling
(1) cobbles, only
(2) cobbles and some pebbles, only
(3) cobbles, pebbles, and some sand, only
(4) cobbles, pebbles, sand, silt, and clay
P.S./E. Sci.–June ’08
[11]
[OVER]
Part B–1
Answer all questions in this part.
Directions (36–50): For each statement or question, write on your separate answer sheet the number of the
word or expression that, of those given, best completes the statement or answers the question. Some questions
may require the use of the Earth Science Reference Tables.
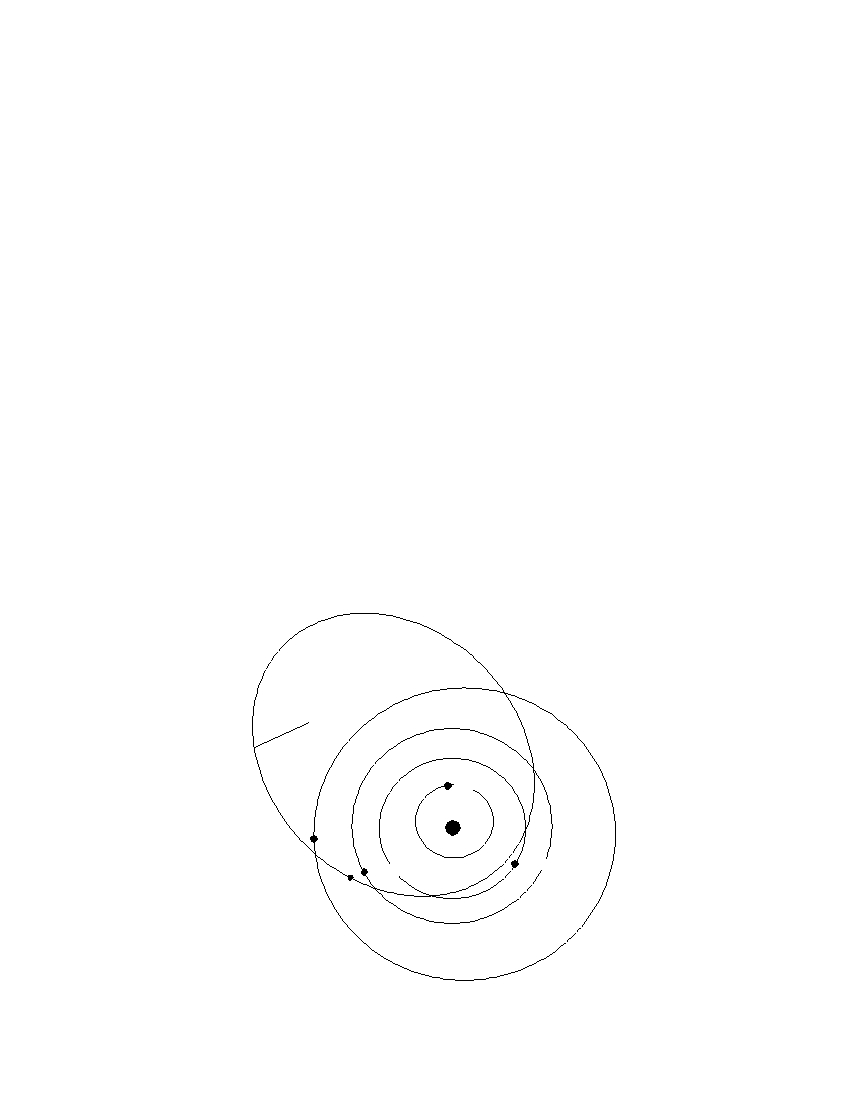
Base your answers to questions 36 through 39 on the passage and diagram below. The diagram shows the
orbits of the four inner planets and the asteroid Hermes around the Sun. Point A represents a position along
Hermes’ orbit.
The Curious Tale of Asteroid Hermes
It’s dogma [accepted belief] now: an asteroid hit Earth 65 million years ago and
wiped out the dinosaurs. But in 1980 when scientists Walter and Luis Alvarez first
suggested the idea to a gathering at the American Association for Advancement of
Sciences, their listeners were skeptical. Asteroids hitting Earth? Wiping out species? It
seemed incredible.
At that very moment, unknown to the audience, an asteroid named Hermes
halfway between Mars and Jupiter was beginning a long plunge toward our planet. Six
months later it would pass 300,000 miles from Earth’s orbit, only a little more than the
distance to the Moon….
Hermes approaches Earth’s orbit twice every 777 days. Usually our planet is far
away when the orbit crossing happens, but in 1937, 1942, 1954, 1974 and 1986,
Hermes came harrowingly [dangerously] close to Earth itself. We know about most
of these encounters only because Lowell Observatory astronomer Brian Skiff
rediscovered Hermes on Oct. 15, 2003.
Astronomers around the world have been tracking it carefully ever since.…
Excerpted from “The Curious Tale of Asteroid Hermes,” Dr. Tony Phillips, Science @ NASA , November 3, 2003
Orbit of
Asteroid Hermes
Mercury
Sun
Mars
Earth
Venus
A
(Not drawn to scale)
P.S./E. Sci.–June ’08
[12]
36 When Hermes is located at position A and Earth
38 Why is evidence of asteroids striking Earth so
is in the position shown in the diagram, the
difficult to find?
asteroid can be viewed from Earth at each of the
(1) Asteroids are made mostly of frozen water
following times except
and gases and are vaporized on impact.
(1) sunrise
(3) 12 noon
(2) Asteroids are not large enough to leave
(2) sunset
(4) 12 midnight
impact craters.
(3) Asteroids do not travel fast enough to create
impact craters.
37 How does the period of revolution of Hermes
(4) Weathering, erosion, and deposition on Earth
compare to the period of revolution of the
have destroyed or buried most impact craters.
planets shown in the diagram?
(1) Hermes has a longer period of revolution
than Mercury, but a shorter period of
39 According to the diagram, as Hermes and the
revolution than Venus, Earth, and Mars.
planets revolve around the Sun, Hermes appears
(2) Hermes has a shorter period of revolution
to be a threat to collide with
than Mercury, but a longer period of
(1) Earth, only
revolution than Venus, Earth, and Mars.
(2) Earth and Mars, only
(3) Hermes has a longer period of revolution
(3) Venus, Earth, and Mars, only
than all of the planets shown.
(4) Mercury, Venus, Earth, and Mars
(4) Hermes has a shorter period of revolution
than all of the planets shown.
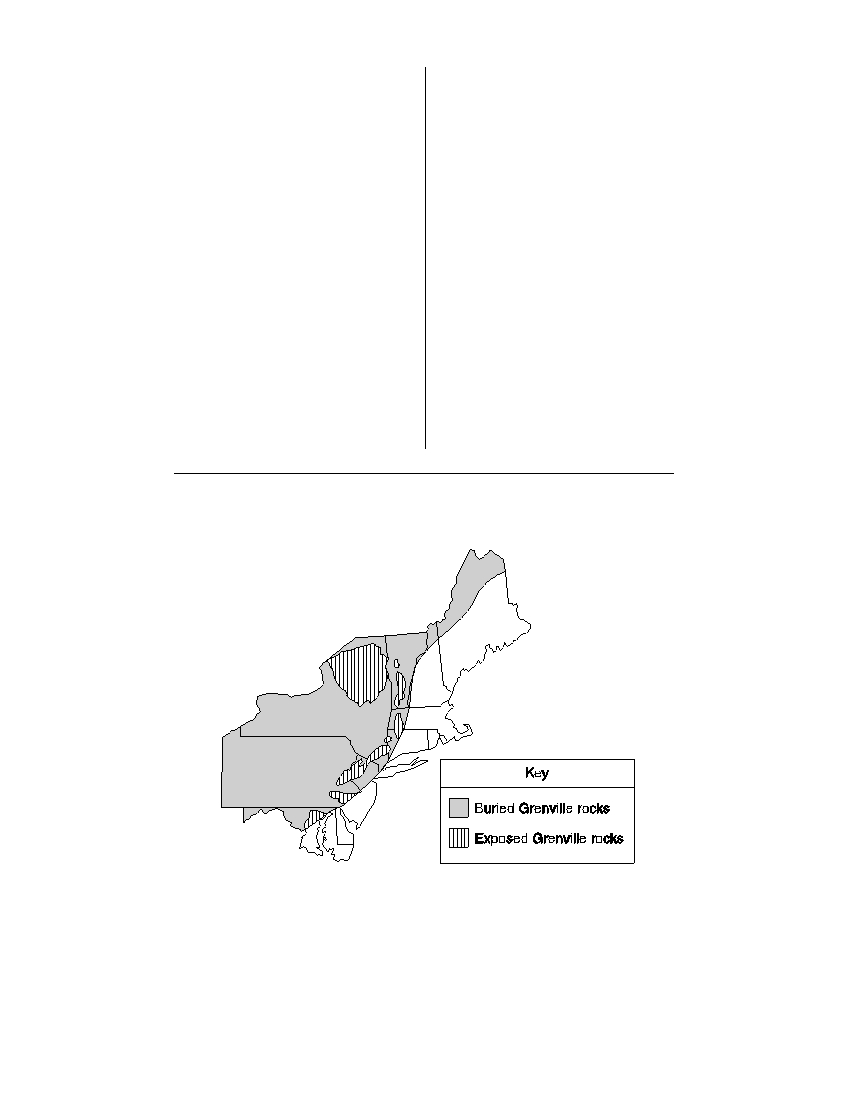
40 The map below shows the location of Grenville-age bedrock found in the northeastern
United States.
In which New York State landscapes is Grenville-age bedrock exposed at Earth’s
surface?
(1) Erie-Ontario Lowlands and St. Lawrence Lowlands
(2) Catskills and Allegheny Plateau
(3) Tug Hill Plateau and Atlantic Coastal Plain
(4) Hudson Highlands and Adirondack Mountains
P.S./E. Sci.–June ’08
[13]
[OVER]
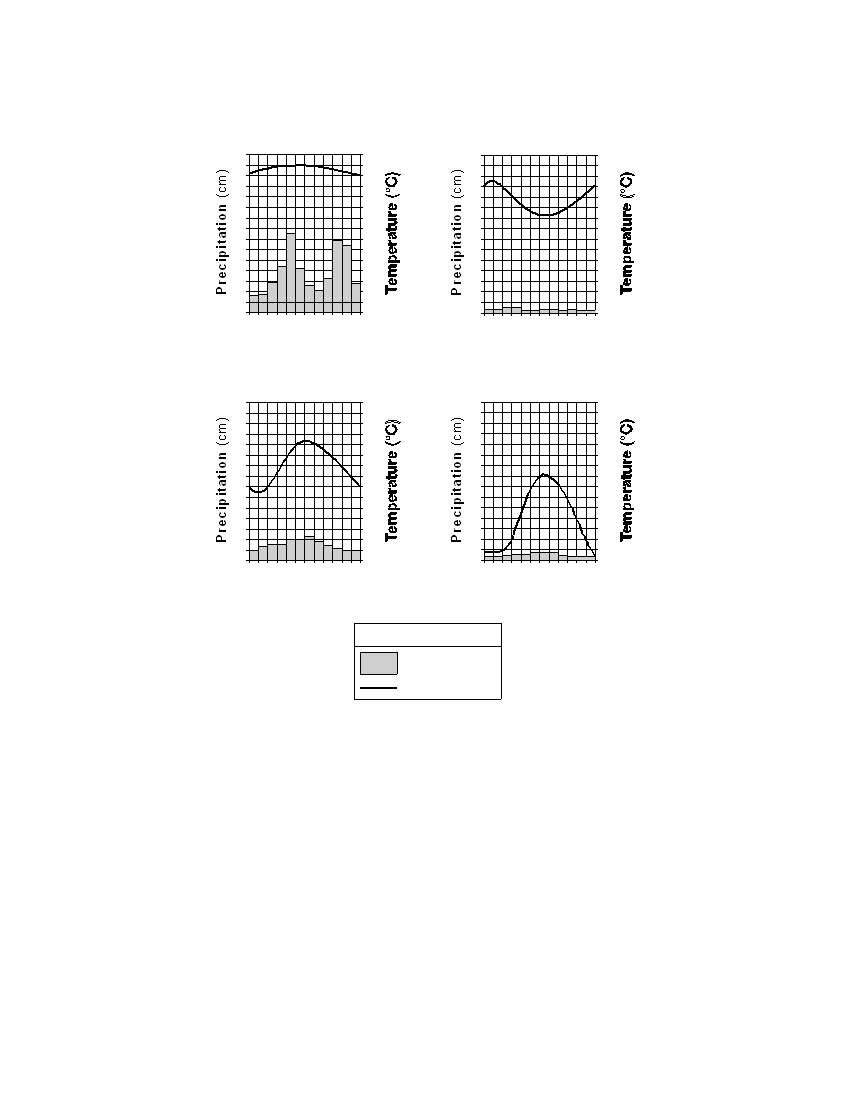
Base your answers to questions 41 through 44 on the climate graphs below, which show average monthly
precipitation and temperatures at four cities, A, B, C, and D.
City A
City C
75
35
75
35
70
30
70
30
65
25
65
25
60
20
60
20
55
15
55
15
50
10
50
10
45
5
45
5
40
0
40
0
35
– 5
35
– 5
30
–10
30
–10
25
–15
25
–15
20
–20
20
–20
15
–25
15
–25
10
–30
10
–30
5
–35
5
–35
0
–40
0
–40
J F M AM J J A S O N D
J F M AM J J A S O N D
Month
Month
City B
City D
75
35
75
35
70
30
70
30
65
25
65
25
60
20
60
20
55
15
55
15
50
10
50
10
45
5
45
5
40
0
40
0
35
– 5
35
– 5
30
–10
30
–10
25
–15
25
–15
20
–20
20
–20
15
–25
15
–25
10
–30
10
–30
5
–35
5
–35
0
–40
0
–40
J F M AM J J A S O N D
J F M AM J J A S O N D
Month
Month
Key
Precipitation
Temperature
41 City A has very little variation in temperature during the year because city A is
located
(1) on the dry side of a mountain
(2) on the wet side of a mountain
(3) near the center of a large landmass
(4) near the equator
42 During which season does city B usually experience the month with the highest
average precipitation?
(1) spring
(3) fall
(2) summer
(4) winter
P.S./E. Sci.–June ’08
[14]
43 It can be concluded that city C is located in the Southern Hemisphere because
city C has
(1) small amounts of precipitation throughout the year
(2) large amounts of precipitation throughout the year
(3) its warmest temperatures in January and February
(4) its warmest temperatures in July and August
44 Very little water will infiltrate the soil around city D because the region usually has
(1) a frozen surface
(3) a small amount of runoff
(2) nearly flat surfaces
(4) permeable soil
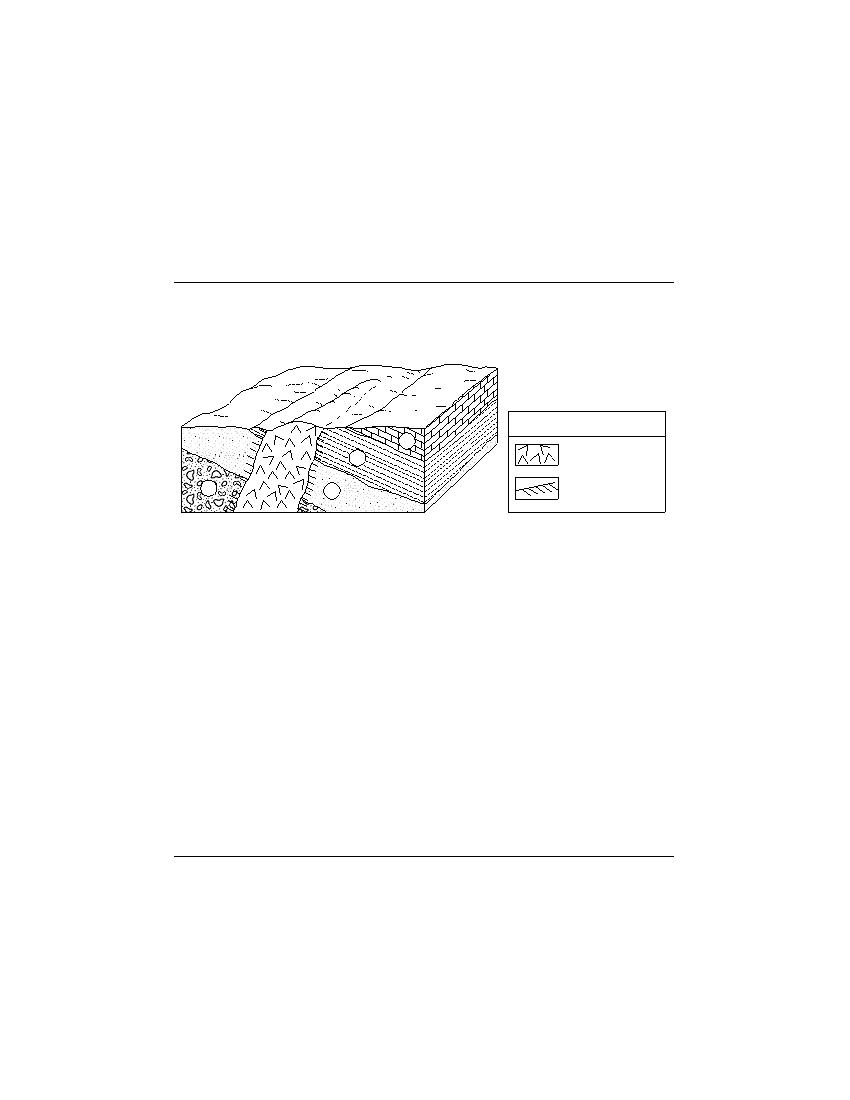
Base your answers to questions 45 through 47 on the block diagram below, which shows a portion of Earth’s
crust. Letters A, B, C, and D indicate sedimentary layers.
Key
D
Igneous
C
rock
A
B
Contact
metamorphism
45 Which event occurred most recently?
(1) formation of layer A
(2) formation of layer D
(3) tilting of all four sedimentary rock layers
(4) erosion of the igneous rock exposed at the surface
46 The igneous rock is mostly composed of potassium feldspar and quartz crystals that
have an average grain size of 3 millimeters. The igneous rock is most likely
(1) granite
(3) gabbro
(2) pegmatite
(4) pumice
47 Which processes produced rock layer B ?
(1) subduction and melting
(3) heat and pressure
(2) uplift and solidification
(4) compaction and cementation
P.S./E. Sci.–June ’08
[15]
[OVER]
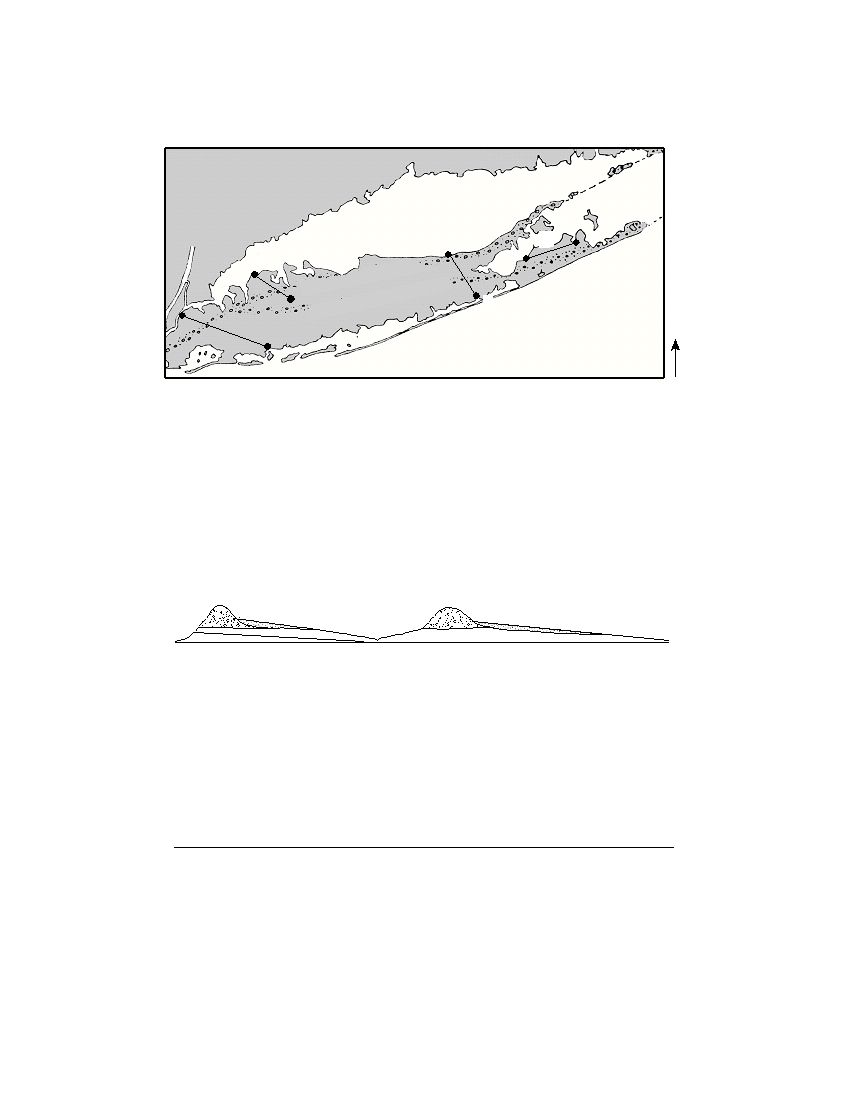
Base your answers to questions 48 through 50 on the map of Long Island, New York. AB, CD, EF, and GH
are reference lines on the map.
Map
Sound
Island
Long
E
H
C
G
Hill Moraine
Harbor
Outwash a M o r a i n e
A
D
R o n k o n k o m
F
Outwash
Atlantic
B
N
Ocean
48 Which agent of erosion transported the sediments that formed the moraines shown
on the map?
(1) water
(3) ice
(2) wind
(4) mass movement
49 The cross section below represents the sediments beneath the land surface along one
of the reference lines shown on the map.
Harbor Hill
Ronkonkoma
Moraine
Moraine
Outwash
Outwash
Along which reference line was the cross section taken?
(1) AB
(3) EF
(2) CD
(4) GH
50 A major difference between sediments in the outwash and sediments in the moraines
is that the sediments deposited in the outwash are
(1) larger
(3) more angular
(2) sorted
(4) older
P.S./E. Sci.–June ’08
[16]

Part B–2
Answer all questions in this part.
Directions (51–65): Record your answers in the spaces provided in your answer booklet. Some questions
may require the use of the Earth Science Reference Tables.
Base your answers to questions 51 through 53 on the cross section in your answer booklet, which shows
limestone bedrock with caves.
51 In the empty box on the left side of the cross section in your answer booklet, draw a
horizontal line to indicate the level of the water table. [1]
52 The precipitation in this area is becoming more acidic. Explain why acid rain weathers
limestone bedrock. [1]
53 Identify one source of pollution caused by human activity that contributes to the
precipitation becoming more acidic. [1]
Base your answers to questions 54 through 58 on the satellite image shown in your answer booklet.
The satellite image shows a low-pressure system over a portion of the United States. Air-mass symbols and
frontal boundaries have been added. Line XY is one frontal boundary. Points A, B, C, and D represent surface
locations. White areas represent clouds.
54 In your answer booklet, draw the proper symbol to represent the most probable front
on line XY. [1]
55 State one process that causes clouds to form in the moist air along the cold
front. [1]
56 Describe one piece of evidence shown on the map that suggests location A has a lower
relative humidity than location B. [1]
57 Explain why location C most likely has a cooler temperature than location D. [1]
58 State the compass direction that the center of this low-pressure system will move over
the next few days if it follows a normal storm track. [1]
P.S./E. Sci.–June ’08
[17]
[OVER]
Base your answers to questions 59 and 60 on the data table below, which provides information about four of
Jupiter’s moons.
Data Table
Moons of Density Diameter
Distance from Jupiter
Jupiter
(g/cm 3 )
(km)
(km)
Io
3.5
3630
421,600
Europa
3.0
3138
670,900
Ganymede
1.9
5262
1,070,000
Callisto
1.9
4800
1,883,000
59 Identify the planet in our solar system that is closest in diameter to Callisto. [1]
60 In 1610, Galileo was the first person to observe, with the aid of a telescope, these four
moons orbiting Jupiter. Explain why Galileo’s observation of this motion did not
support the geocentric model of our solar system. [1]
Base your answers to questions 61 and 62 on the cross section below, which shows a portion of Earth’s
interior layers and the location of an earthquake epicenter. Letter A represents a seismic station on Earth’s
surface. Letter B represents a location in Earth’s interior.
B
Mantle
Outer
A
core
Inner
Earthquake
core
epicenter
(Not drawn to scale)
61 Explain why seismic station A receives P -waves but not S -waves from this
earthquake. [1]
62 What is the approximate depth at location B ? [1]
P.S./E. Sci.–June ’08
[18]
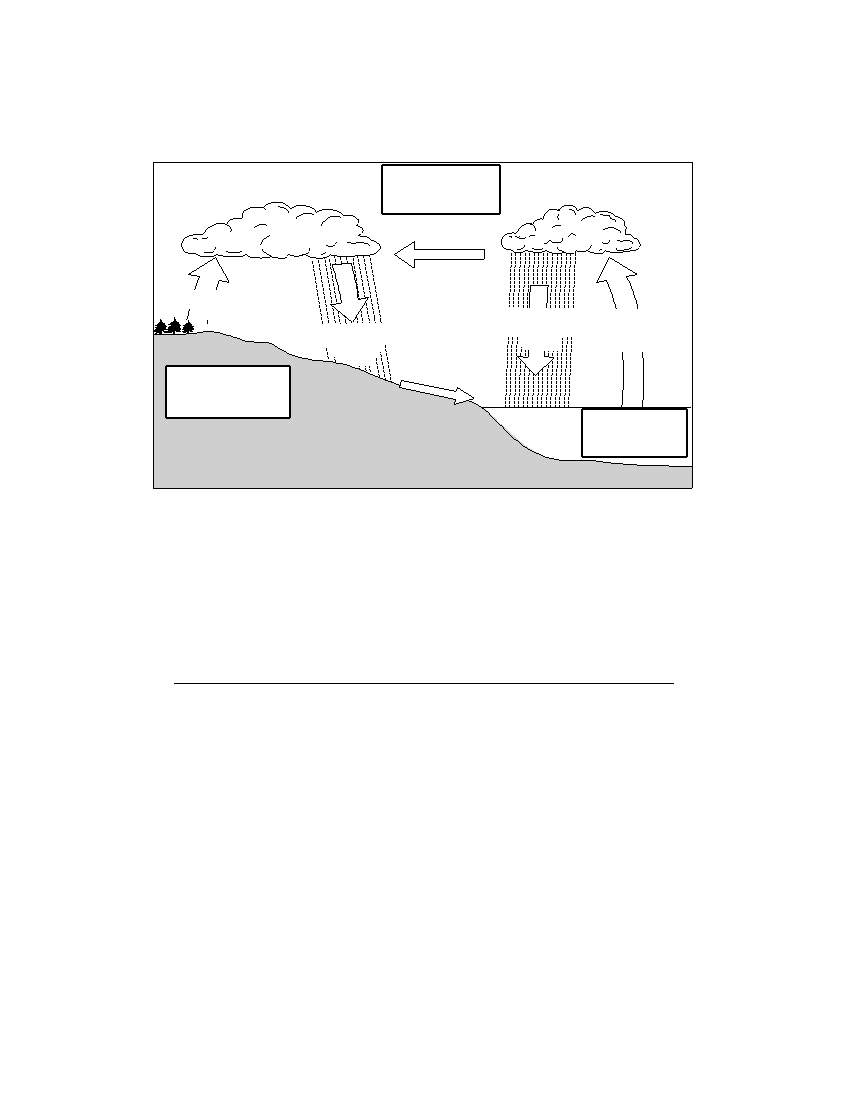
Base your answers to questions 63 through 65 on the diagram below, which shows Earth’s water cycle.
Numbers indicate the estimated volume of water, in millions of cubic kilometers, stored at any one time in the
atmosphere, the oceans, and on the continents. The yearly amount of water that moves in and out of each of
these three portions of Earth is also indicated in millions of cubic kilometers.
TOTAL STORED
IN ATMOSPHERE
0.013
Water vapor
transport
Evaporation/transpiration
from land
Precipitation
Evaporation
0.073
Precipitation
into ocean
from ocean
onto land
0.386
0.423
0.110
S
TOTAL STORED
t r e a m r u n o f f
ON CONTINENTS
38.631
TOTAL STORED
IN OCEANS
1370.000
63 Calculate the total amount of water stored in the atmosphere, the oceans, and on the
continents together at any one time. [1]
64 Explain why the yearly total precipitation over the oceans is greater than the yearly
total precipitation over the continents. [1]
65 Describe two surface characteristics that will affect the rate of stream runoff into the
ocean. [1]
P.S./E. Sci.–June ’08
[19]
[OVER]
Part C
Answer all questions in this part.
Directions (66–84): Record your answers in the spaces provided in your answer booklet. Some questions
may require the use of the Earth Science Reference Tables.
Base your answers to questions 66 through 68 on the data table below, which shows the radioactive decay of
carbon-14. The number of years required to complete four half-lives has been left blank.
Radioactive Decay of Carbon-14 1
Percentage
Number of
of Original
Time
Half-Lives
Carbon-14
(years)
Remaining
0
100
0
1
50
5700
2
25
11,400
3
12.5
17,100
4
6.3
5
3.1
28,500
6
1.6
34,200
66 On the grid in your answer booklet, construct a graph that shows the radioactive
decay of carbon-14 by plotting an X to show the percentage of original carbon-14
remaining after each half-life. Connect the X s with a smooth, curved line. [1]
67 How long does it take for radioactive carbon-14 to complete four half-lives? [1]
68 The cross section below shows part of Earth’s crust. The objects in parentheses
indicate materials found within each rock unit or deposit.
Ordovician shale
Pleistocene glacial deposits
(graptolite)
(tree trunk)
Cambrian sandstone
(trilobite)
diorite
crystal)
Precambrian gneiss
(garnet crystal)
Cretaceous
(plagioclase
Which object in parentheses could be accurately dated using carbon-14? Explain
your answer. [1]
P.S./E. Sci.–June ’08
[20]
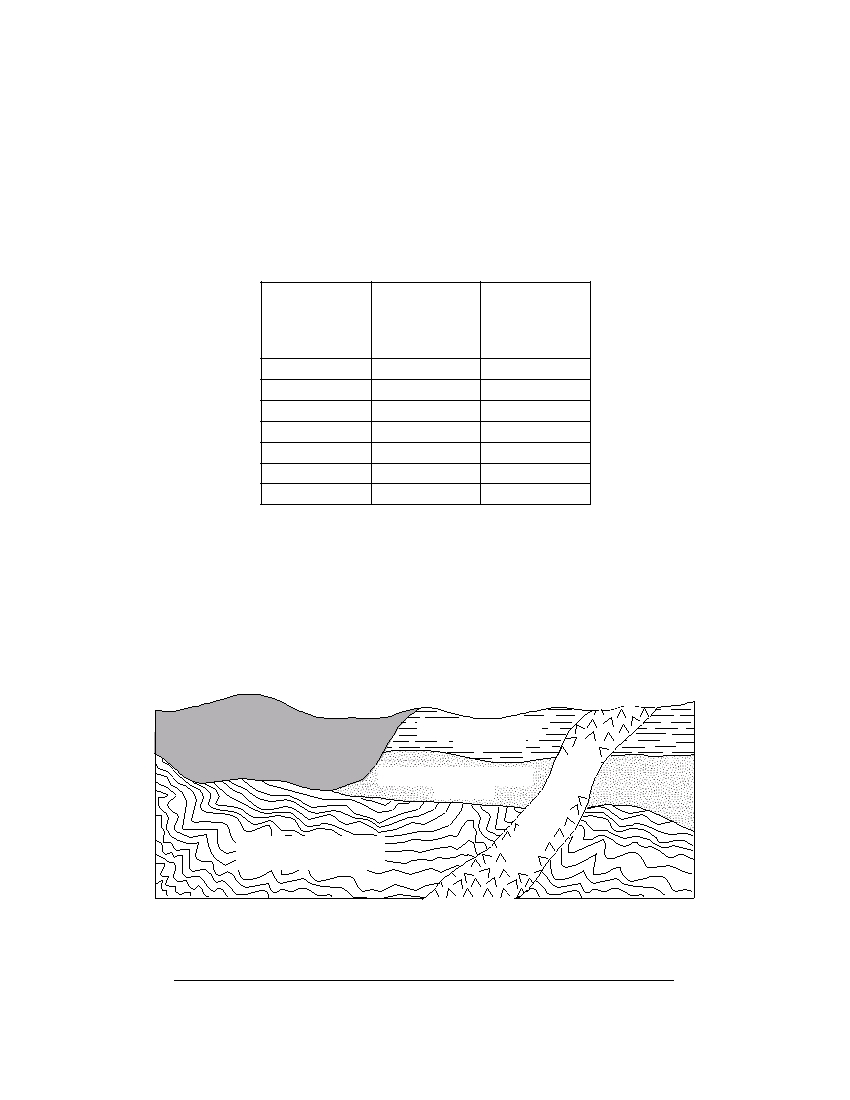
Base your answers to questions 69 through 73 on the passage and cross section below, which explain how
some precious gemstones form. The cross section shows a portion of the ancient Tethys Sea, once located
between the Indian-Australian Plate and the Eurasian Plate.
Precious Gemstones
Some precious gemstones are a form of the mineral corundum, which has a hard-
ness of 9. Corundum is a rare mineral made up of closely packed aluminum and
oxygen atoms, and its formula is Al 2 O 3 . If small amounts of chromium replace some
of the aluminum atoms in corundum, a bright-red gemstone called a ruby is produced.
If traces of titanium and iron replace some aluminum atoms, deep-blue sapphires can
be produced.
Most of the world’s ruby deposits are found in metamorphic rock that is located
along the southern slope of the Himalayas, where plate tectonics played a part in ruby
formation. Around 50 million years ago, the Tethys Sea was located between what is
now India and Eurasia. Much of the Tethys Sea bottom was composed of limestone
that contained the elements needed to make these precious gemstones. The Tethys
Sea closed up as the Indian-Australian Plate pushed under the Eurasian Plate, creat-
ing the Himalayan Mountains. The limestone rock lining the seafloor underwent
metamorphism as it was pushed deep into Earth by the Indian-Australian Plate. For
the next 40 to 45 million years, as the Himalayas rose, rubies, sapphires, and other
gemstones continued to form.
A Portion of the Tethys Sea 50 Million Years Ago
Tethys Sea
Indian-
Australian
Eurasian Plate
Plate
Limestone
North
69 Which element replaces some of the aluminum atoms, causing the bright-red color
of a ruby? [1]
70 State one physical property of rubies, other than a bright-red color, that makes them
useful as gemstones in jewelry. [1]
71 Identify the metamorphic rock in which the rubies and sapphires that formed along
the Himalayas are usually found. [1]
72 During which geologic epoch did the events shown in the cross section of the Tethys
Sea occur? [1]
73 What type of tectonic plate boundary is shown in the cross section? [1]
P.S./E. Sci.– June ’08
[21]
[OVER]
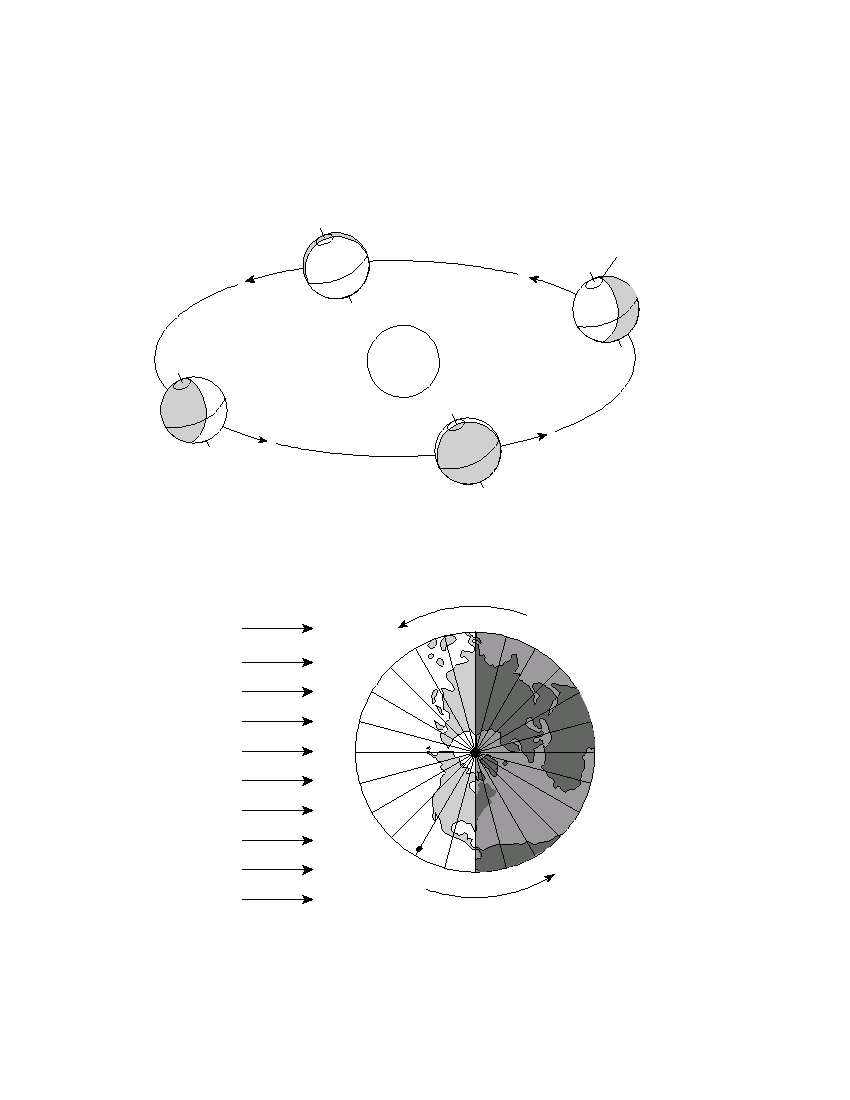
Base your answers to questions 74 through 77 on the diagrams below. Diagram 1 shows Earth’s location in
its orbit on the first day of each of the four seasons, labeled A through D. Diagram 2 shows a north polar view
of Earth on March 21. Point E represents a location on Earth’s surface. Longitude lines are shown at 15°
intervals.
Diagram 1
N
C
r
Arctic Circle
N
E q u
a
t o
Night
Day
B
N
Sun
Day
Night
N
D
A
(Not drawn to scale)
Diagram 2
Sun’s
Noon
rays
E
March 21
P.S./E. Sci.–June ’08
[22]

74 How does the altitude of the Sun at solar noon appear to change each day for an
observer in New York State as Earth moves from position A to position B to
position C ? [1]
75 Explain why the duration of insolation is 12 hours at both the Arctic Circle and the
equator when Earth is at position C. [1]
76 Describe one piece of evidence shown in the diagram which indicates that the
Northern Hemisphere is experiencing winter at position D. [1]
77 State the hour of the day at point E . [1]
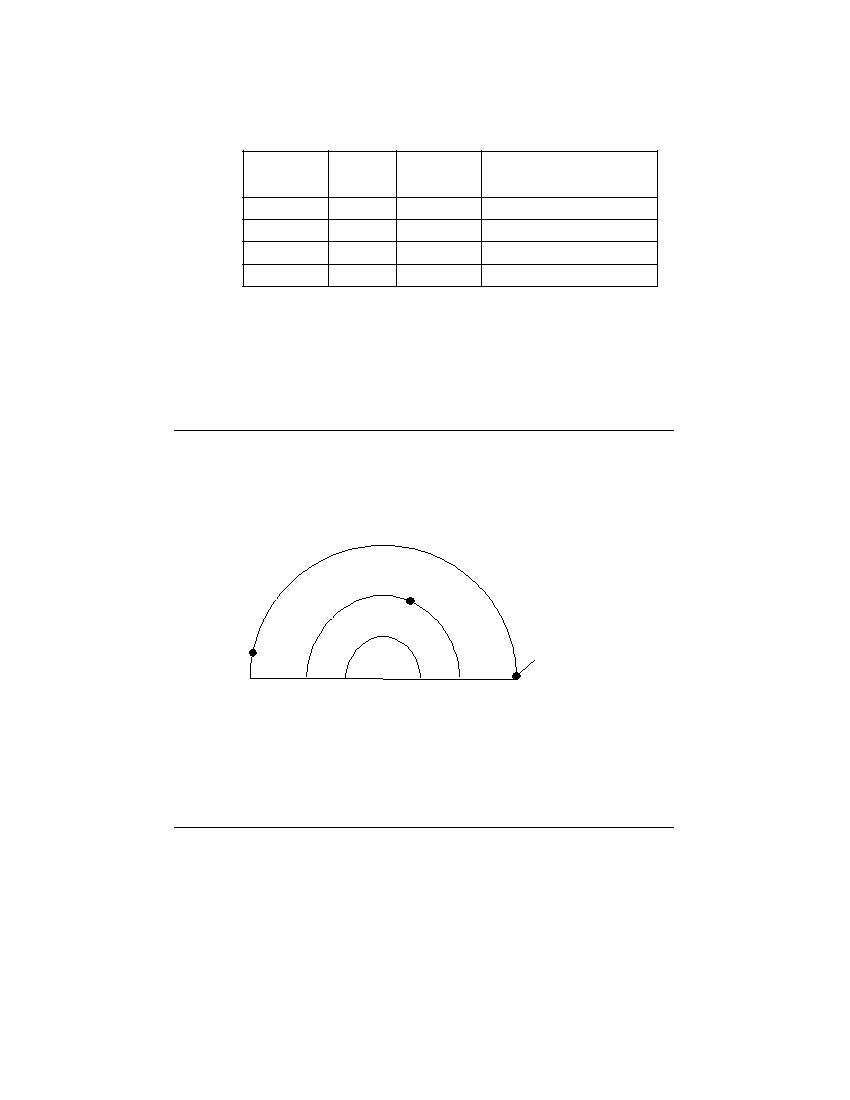
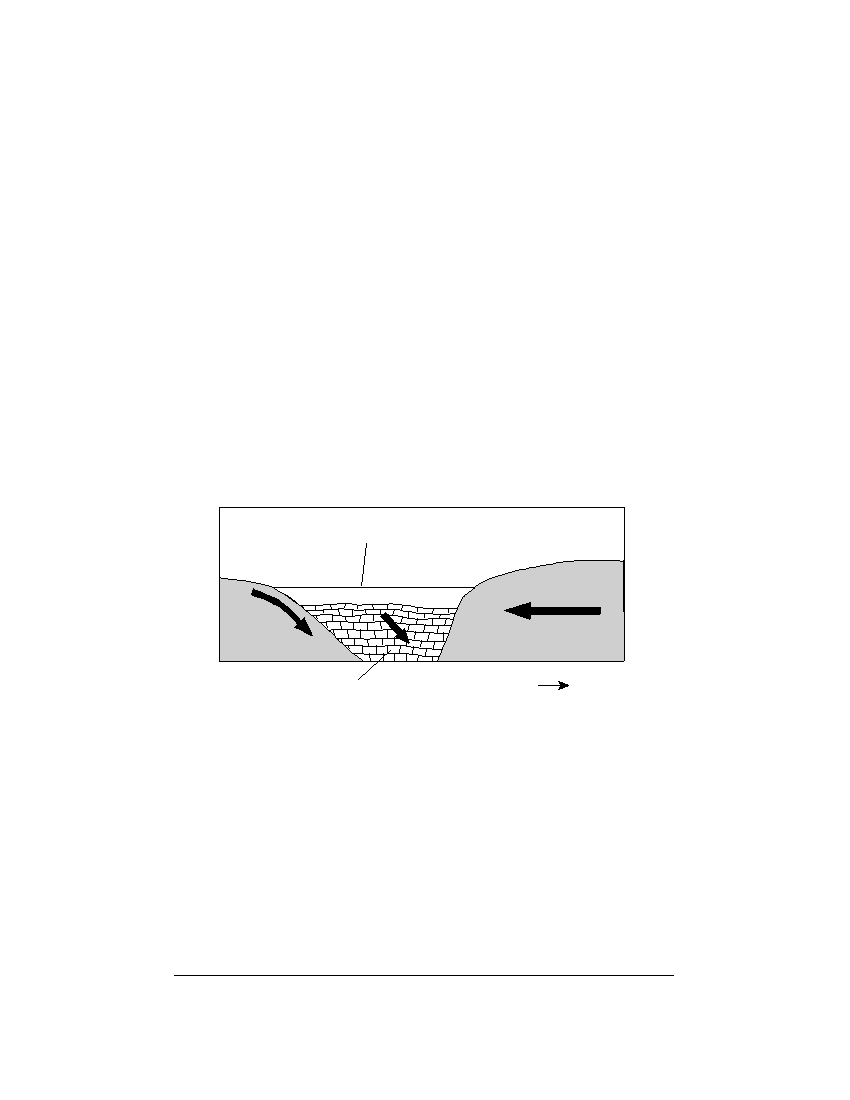
Base your answers to questions 78 through 80 on the map in your answer booklet. The map shows the water
depth, measured in feet, at the north end of one of the Finger Lakes. Points A and B are locations at the lake’s
shoreline. Points X and Y are locations on the bottom of the lake.
78 On the map in your answer booklet, draw the 20-foot-depth isoline. The isoline must
extend to the edge of the map. [1]
79 On the grid in your answer booklet, construct a profile along the line from point A to
point B. Plot the depth along line AB by marking an X at each numbered point where
a water depth is shown. Complete the profile by connecting the X s with a smooth,
curved line. The X s for point A and point B have been plotted. [2]
80 Calculate the gradient between point X and point Y. Label your answer with the
correct units. [1]
P.S./E. Sci.–June ’08
[23]
[OVER]
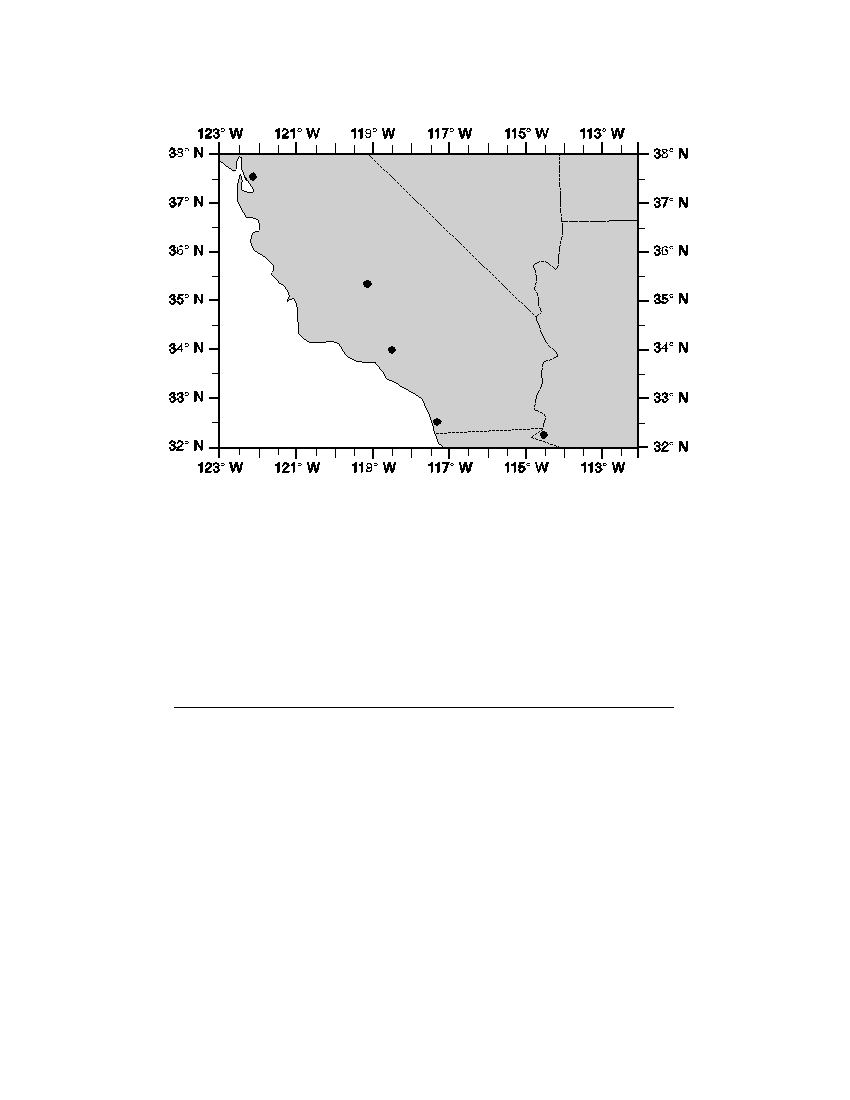
Base your answers to questions 81 through 84 on the map below, which shows a portion of southwestern
United States. On January 17, 1994, an earthquake occurred with an epicenter at Northridge, California.
Oakland
NEVADA
UTAH
CALIFORNIA
Bakersfield
ARIZONA
Northridge
San Diego
Yuma
81 State the latitude and longitude of Northridge, California. Include the correct units
and compass directions in your answer. [1]
82 Explain why earthquakes are common in this region of California. [1]
83 Of the cities shown on the map, explain why Oakland was the last city to receive
P -waves from this earthquake. [1]
84 List two actions that a homeowner could take to prepare the home or family for the
next earthquake. [1]
P.S./E. Sci.–June ’08
[24]


The University of the State of New York
R EGENTS H IGH S CHOOL E XAMINATION
PHYSICAL SETTING
EARTH SCIENCE
Friday, June 20, 2008 — 1:15 to 4:15 p.m., only
ANSWER SHEET
Student . . . . . . . . . . . . . . . . . . . . . . . . . . . . . . . . . . . . . . . . . . . . . . .
Sex:
I Male I Female Grade . . . . . . . . . . . .
Teacher . . . . . . . . . . . . . . . . . . . . . . . . . . . . . . . . . . . . . . . . . . . . . . .
School . . . . . . . . . . . . . . . . . . . . . . . . . . . . . . . . . . . .
Record your answers to Part A and Part B–1 on this answer sheet.
Part A
Part B–1
1 . . . . . . . . . . . .
13 . . . . . . . . . . . .
25 . . . . . . . . . . .
36 . . . . . . . . . . . .
44 . . . . . . . . . . . .
2 . . . . . . . . . . . .
14 . . . . . . . . . . . .
26 . . . . . . . . . . .
37 . . . . . . . . . . . .
45 . . . . . . . . . . . .
3 . . . . . . . . . . . .
15 . . . . . . . . . . . .
27 . . . . . . . . . . .
38 . . . . . . . . . . . .
46 . . . . . . . . . . . .
4 . . . . . . . . . . . .
16 . . . . . . . . . . . .
28 . . . . . . . . . . .
39 . . . . . . . . . . . .
47 . . . . . . . . . . . .
5 . . . . . . . . . . . .
17 . . . . . . . . . . . .
29 . . . . . . . . . . .
40 . . . . . . . . . . . .
48 . . . . . . . . . . . .
6 . . . . . . . . . . . .
18 . . . . . . . . . . . .
30 . . . . . . . . . . .
41 . . . . . . . . . . . .
49 . . . . . . . . . . . .
7 . . . . . . . . . . . .
19 . . . . . . . . . . . .
31 . . . . . . . . . . .
42 . . . . . . . . . . . .
50 . . . . . . . . . . . .
Part B–1 Score
8 . . . . . . . . . . . .
20 . . . . . . . . . . . .
32 . . . . . . . . . . .
43 . . . . . . . . . . . .
9 . . . . . . . . . . . .
21 . . . . . . . . . . . .
33 . . . . . . . . . . .
10 . . . . . . . . . . . .
22 . . . . . . . . . . . .
34 . . . . . . . . . . .
11 . . . . . . . . . . . .
23 . . . . . . . . . . . .
35 . . . . . . . . . . .
Part A Score
12 . . . . . . . . . . . .
24 . . . . . . . . . . . .
Write your answers to Part B–2 and Part C in your answer booklet.
The declaration below must be signed when you have completed the examination.
I do hereby affirm, at the close of this examination, that I had no unlawful knowledge of the questions or answers prior to
the examination and that I have neither given nor received assistance in answering any of the questions during the examination.
Signature

PS/EARTH SCIENCE
E C N E I C S H T R A E / S P