
PS/EARTH SCIENCE
The University of the State of New York
REGENTS HIGH SCHOOL EXAMINATION
PHYSICAL SETTING
EARTH SCIENCE
Wednesday, January 26, 2005 — 1:15 to 4:15 p.m., only
This is a test of your knowledge of Earth science. Use that knowledge to answer
all questions in this examination. Some questions may require the use of the Earth
Science Reference Tables. The Earth Science Reference Tables are supplied separately.
Be certain you have a copy of the 2001 edition of these reference tables before you
begin the examination.
Your answer sheet for Part A and Part B–1 is the last page of this examination
booklet. Turn to the last page and fold it along the perforations. Then, slowly and
carefully, tear off your answer sheet and fill in the heading.
The answers to the questions in Part B–2 and Part C are to be written in your
separate answer booklet. Be sure to fill in the heading on the front of your answer
booklet.
You are to answer all questions in all parts of this examination according to the
directions provided in the examination booklet. Record your answers to the Part A
and Part B–1 multiple-choice questions on your separate answer sheet. Write your
answers to the Part B–2 and Part C questions in your answer booklet. All work should
be written in pen, except for graphs and drawings, which should be done in pencil.
You may use scrap paper to work out the answers to the questions, but be sure to
record all your answers on your separate answer sheet and in your answer booklet.
When you have completed the examination, you must sign the statement printed
at the end of your separate answer sheet, indicating that you had no unlawful
knowledge of the questions or answers prior to the examination and that you have
neither given nor received assistance in answering any of the questions during the
examination. Your answer sheet and answer booklet cannot be accepted if you fail to
sign this declaration.
Notice. . .
A four-function or scientific calculator and a copy of the 2001 Earth Science Reference Tables
must be available for you to use while taking this examination.
DO NOT OPEN THIS EXAMINATION BOOKLET UNTIL THE SIGNAL IS GIVEN.
E C N E I C S H T R A E / S P
Part A
Answer all questions in this part.
Directions (1–35): For each statement or question, write on your separate answer sheet the number of the
word or expression that, of those given, best completes the statement or answers the question. Some questions
may require the use of the Earth Science Reference Tables .
1 Which planet’s orbit around the Sun is most
5 The diagram below shows a standard spectrum
nearly circular?
compared to a spectrum produced from a distant
(1) Mercury
(3) Pluto
star.
(2) Neptune
(4) Venus
Standard Spectrum
Spectral
2 How many times will the Sun’s perpendicular
lines
rays cross Earth’s Equator between March 1 of
Ultraviolet
Infrared
one year and March 1 of the next year?
Visible light
(1) 1
(3) 3
(2) 2
(4) 4
Spectrum from Distant Star
3 Which star’s surface temperature is closest to the
Spectral
lines
temperature at the boundary between Earth’s
Ultraviolet
Infrared
mantle and core?
Visible light
(1) Sirius
(3) the Sun
(2) Rigel
(4) Betelgeuse
Which conclusion can be made by comparing the
standard spectrum to the spectrum produced
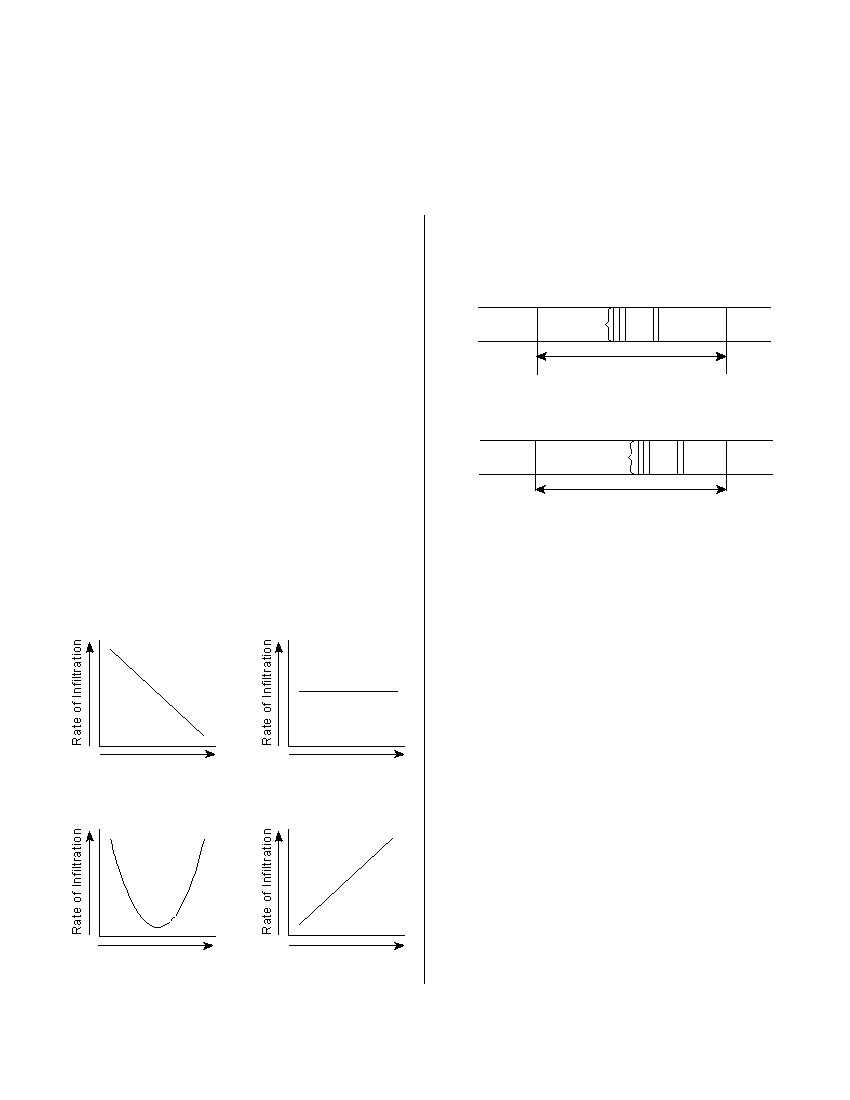
4 Which graph best represents the relationship
from this distant star?
between soil particle size and the rate at which
(1) The star’s spectral lines have shifted toward
water infiltrates permeable soil?
the ultraviolet end of the spectrum and the
star is moving toward Earth.
(2) The star’s spectral lines have shifted toward
the ultraviolet end of the spectrum and the
star is moving away from Earth.
(3) The star’s spectral lines have shifted toward
the infrared end of the spectrum and the star
is moving toward Earth.
Soil Particle Size
Soil Particle Size
(4) The star’s spectral lines have shifted toward
the infrared end of the spectrum and the star
( 1 )
( 3 )
is moving away from Earth.
6 Scientists are concerned about the decrease in
ozone in the upper atmosphere primarily because
ozone protects life on Earth by absorbing certain
wavelengths of
(1) x-ray radiation
(2) ultraviolet radiation
Soil Particle Size
Soil Particle Size
(3) infrared radiation
( 2 )
( 4 )
(4) microwave radiation
P.S./E. Sci.–Jan. ’05
[2]
7 It is inferred that during the early Archean Era
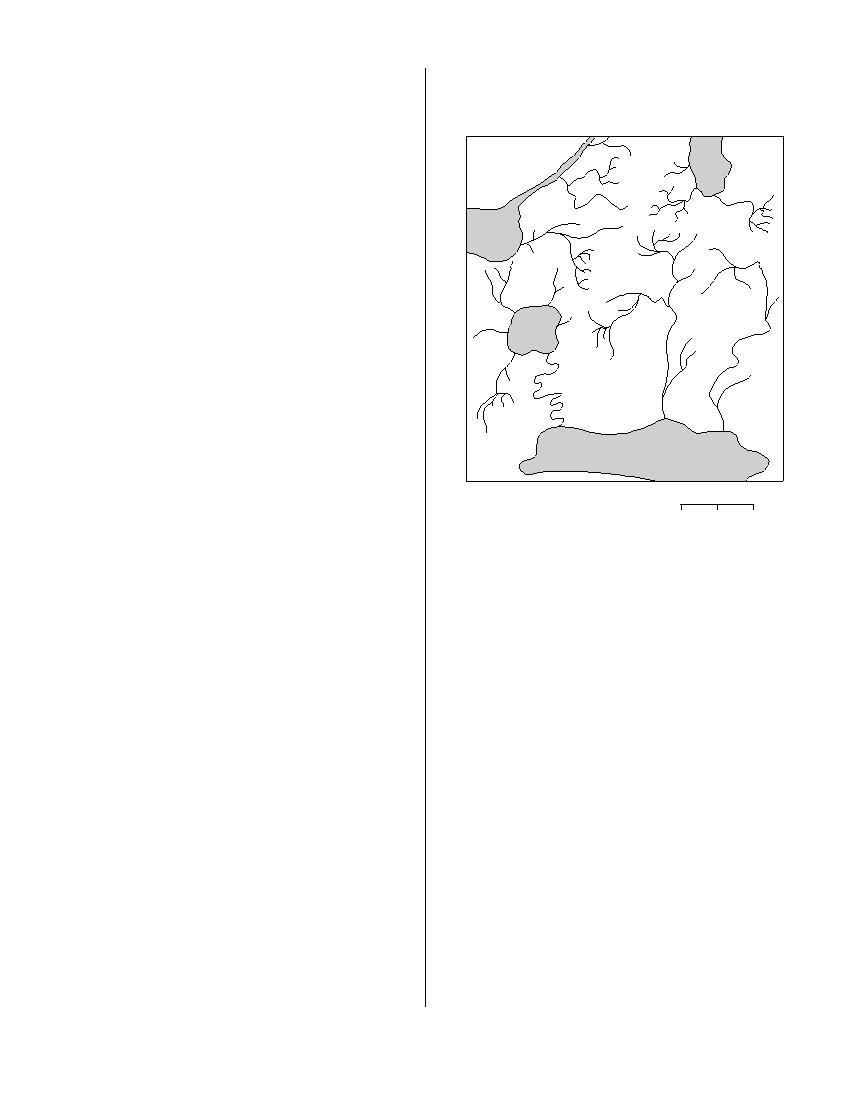
14 The map below shows the stream drainage pat-
the atmosphere of Earth contained water vapor,
terns for a region of Earth’s surface. Points A, B,
carbon dioxide, nitrogen, and other gases in small
C, and D are locations in the region.
amounts. These gases probably came from
(1) precipitation of groundwater
(2) volcanic eruptions
Lake
(3) evaporation of Paleozoic oceans
(4) convection currents in the mantle
Lake
8 Which ocean current flows northeast along the
eastern coast of North America?
(1) Gulf Stream
(3) California
(2) North Equatorial
(4) Labrador
Lake
9 Which type of land surface would probably reflect
the most incoming solar radiation?
(1) light colored and smooth
(2) light colored and rough
D
(3) dark colored and smooth
(4) dark colored and rough
Lake
10 There is evidence that an asteroid or a comet
crashed into the Gulf of Mexico at the end of the
0
10
20 km
Mesozoic Era. Consequences of this impact
event may explain the
The highest elevation most likely exists at point
(1) extinction of many kinds of marine animals,
(1) A
(3) C
including trilobites
(2) B
(4) D
(2) extinction of ammonoids and dinosaurs
(3) appearance of the earliest birds and mammals
15 Outwash plains are formed as a result of deposi-
(4) appearance of great coal-forming forests and
tion by
insects
(1) landslides
(2) ocean waves
11 What is the approximate location of the Canary
(3) winds from hurricanes
Islands hot spot?
(4) meltwater from glaciers
(1) 32° S 18° W
(3) 32° N 18° W
(2) 32° S 18° E
(4) 32° N 18° E
16 A stream with a velocity of 100 centimeters per
second flows into a lake. Which sediment-size
12 How long would it take for the first S -wave to
particles would the stream most likely deposit first
arrive at a seismic station 4,000 kilometers away
as it enters the lake?
from the epicenter of an earthquake?
(1) boulders
(3) pebbles
(1) 5 min 40 sec
(3) 12 min 40 sec
(2) cobbles
(4) sand
(2) 7 min 0 sec
(4) 13 min 20 sec
13 Which New York State river flows generally
southward?
(1) St. Lawrence River
(3) Genesee River
(2) Niagara River
(4) Hudson River
P.S./E. Sci.–Jan. ’05
[3]
[OVER]
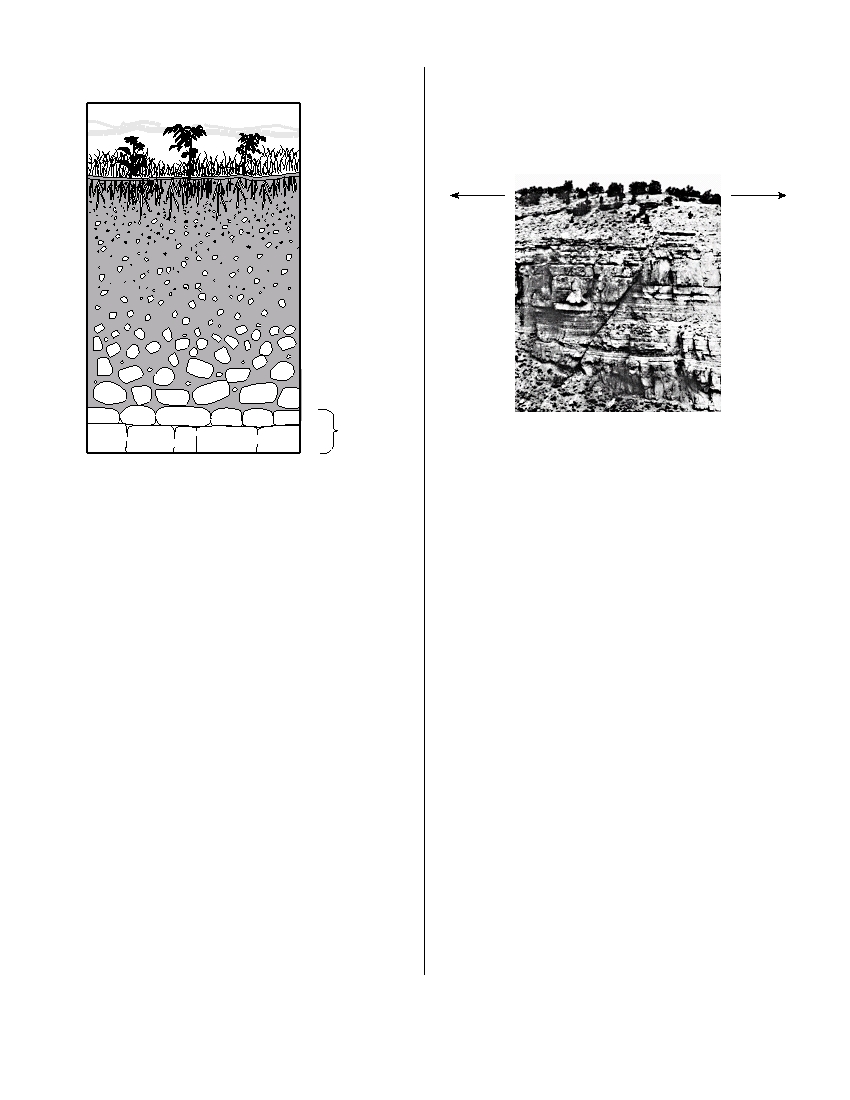
17 The cross section below shows a soil profile.
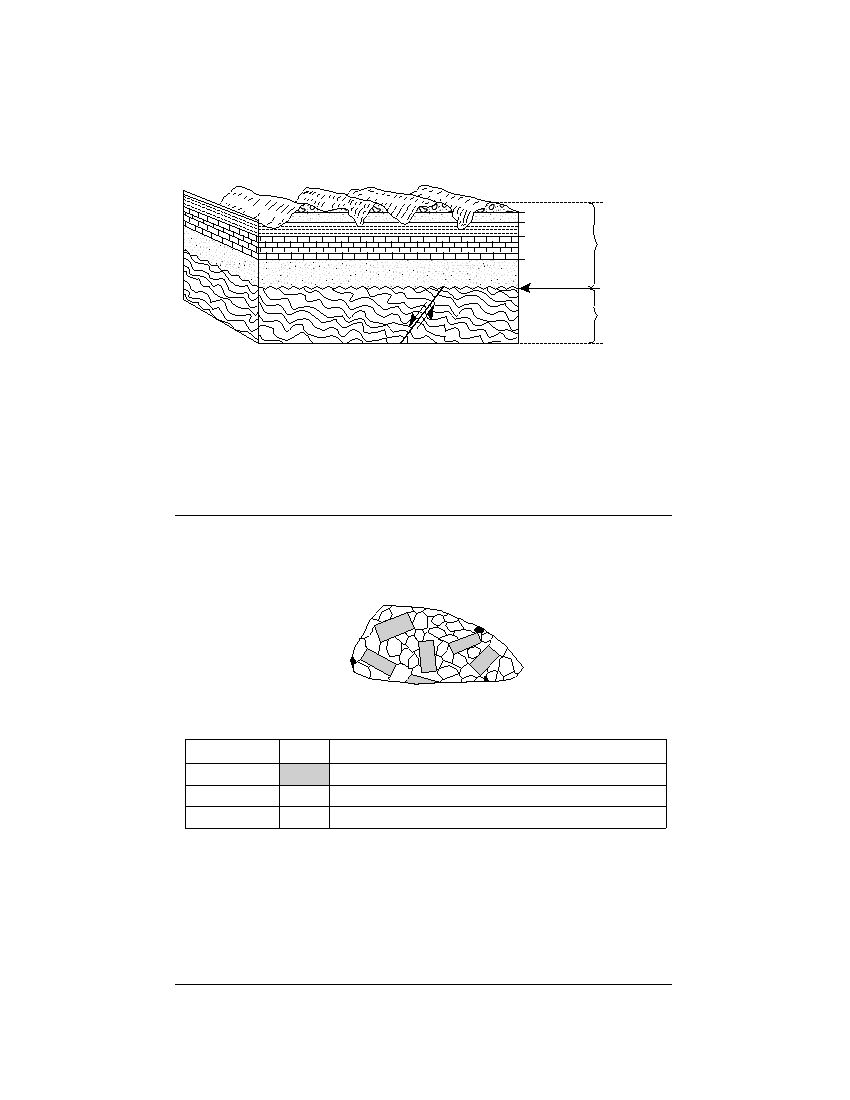
21 The photograph below shows an escarpment
(cliff) located in the western United States. The
directions for north and south are indicated by
arrows. A fault in the sedimentary rocks is shown
on the front of the escarpment.
North
South
Bedrock
The photograph shows that the fault most likely
formed
This soil was formed primarily by
(1) after the rock layers were deposited, when
(1) erosion by glaciers
the north side moved downward
(2) erosion by running water
(2) after the rock layers were deposited, when
(3) capillarity and human activity
the north side moved upward
(4) weathering and biological activity
(3) before the rock layers were deposited, when
the south side moved downward
(4) before the rock layers were deposited, when
18 Which type of rock most likely contains fossils?
the south side moved upward
(1) scoria
(3) schist
(2) gabbro
(4) shale
22 Which mountain range resulted from the colli-
sion of North America and Africa, as parts of
19 In which New York State landscape region is
Pangea joined together in the late Pennsylvanian
most of the surface bedrock composed of meta-
Period?
morphic rock?
(1) Appalachian Mountains
(1) Adirondacks
(2) Acadian Mountains
(2) Catskills
(3) Taconic Mountains
(3) Erie-Ontario Lowlands
(4) Grenville Mountains
(4) Newark Lowlands
23 Which physical characteristic best describes the
20 A human fingernail has a hardness of approxi-
rock phyllite?
mately 2.5. Which two minerals are softer than a
(1) glassy texture with gas pockets
human fingernail?
(2) clastic texture with angular fragments
(1) calcite and halite
(3) bioclastic texture with cemented shell frag-
(2) sulfur and fluorite
ments
(3) graphite and talc
(4) foliated texture with microscopic mica crystals
(4) pyrite and magnetite
P.S./E. Sci.–Jan. ’05
[4]
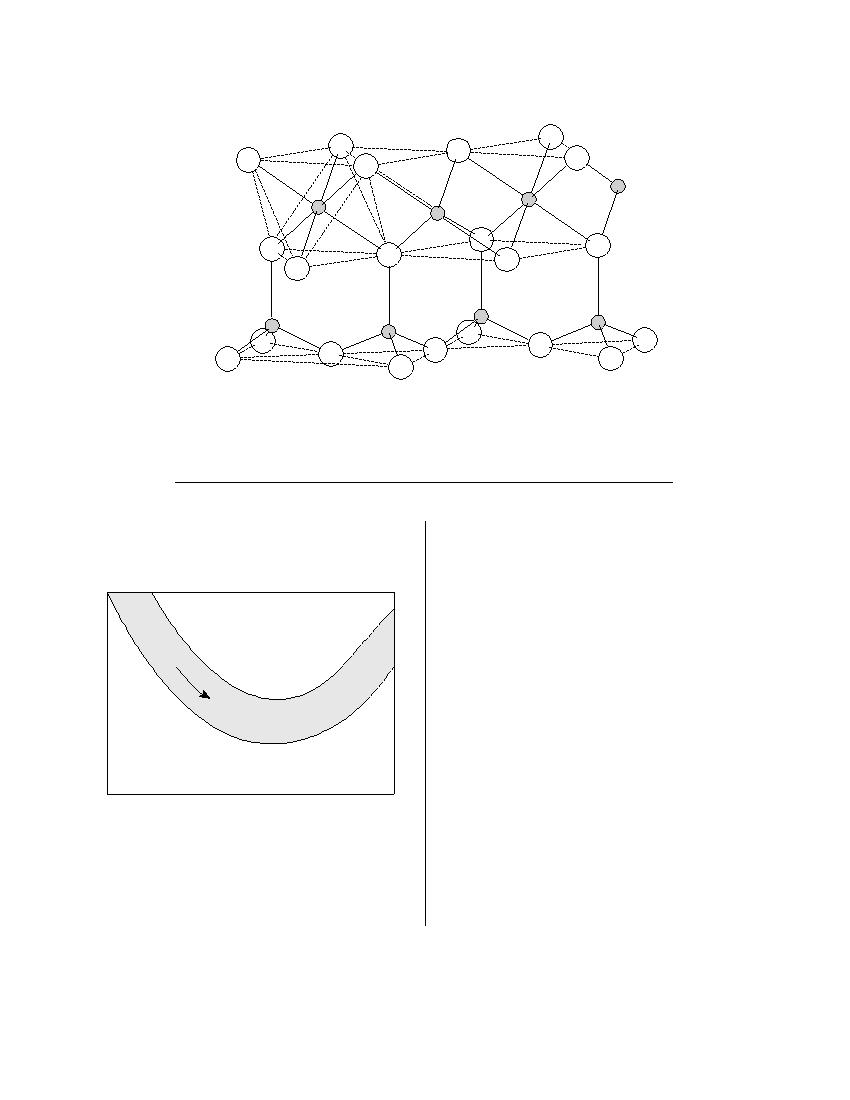
24 The diagram below represents a part of the crystal structure of the mineral kaolinite.
Structure of Kaolinite
An arrangement of atoms such as the one shown in the diagram determines a mineral’s
(1) age of formation
(3) physical properties
(2) infiltration rate
(4) temperature of formation
25 The map below shows the path of a river. The
26 Which home-building material is made mostly
arrow shows the direction the river is flowing.
from the mineral gypsum?
Letters A and B identify the banks of the river.
(1) plastic pipes
(3) drywall panels
(2) window glass
(4) iron nails
River
27 The two most abundant elements by mass in
Earth’s crust are oxygen and
(1) potassium
(3) nitrogen
B
(2) hydrogen
(4) silicon
A
The water depth is greater near bank A than bank B
because the water velocity near bank A is
(1) faster, causing deposition to occur
(2) faster, causing erosion to occur
(3) slower, causing deposition to occur
(4) slower, causing erosion to occur
P.S./E. Sci.–Jan. ’05
[5]
[OVER]
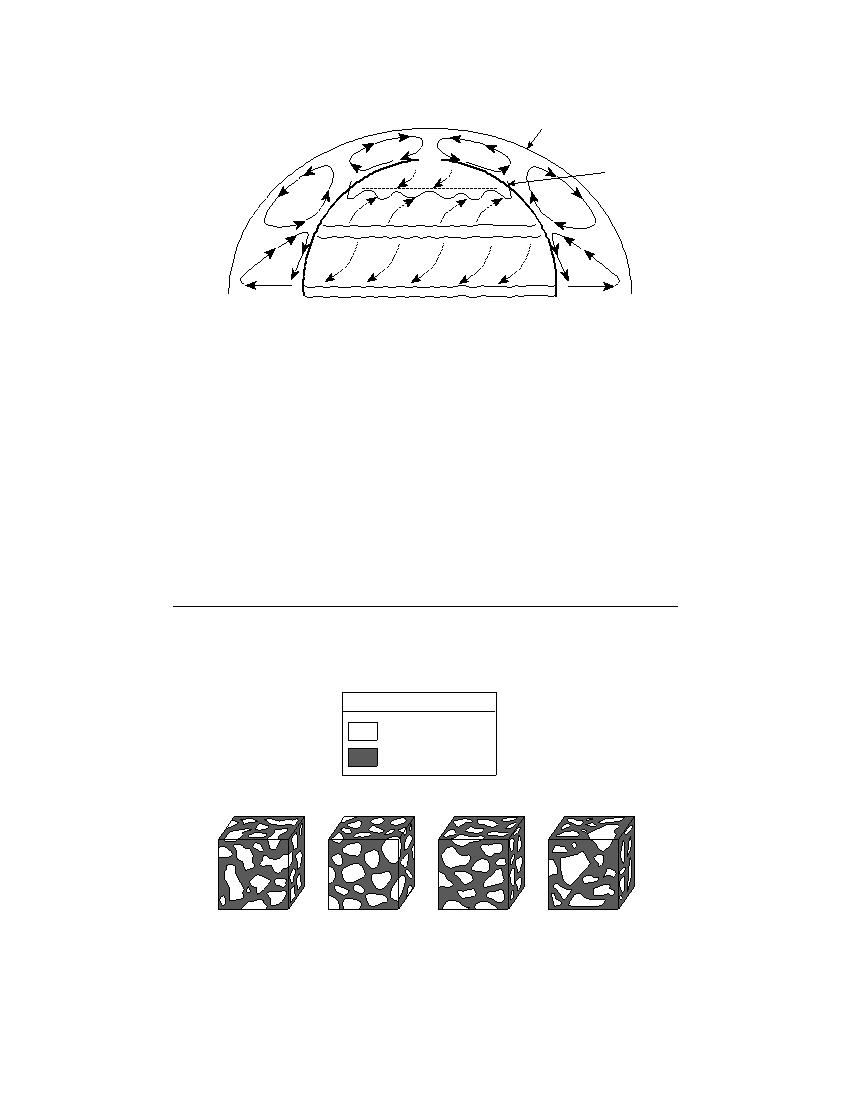
Base your answers to questions 28 through 30 on the diagram below, which represents the planetary wind
and moisture belts in Earth’s Northern Hemisphere.
Tropopause
DRY
Polar front
WET
60 ° N
DRY
30 ° N
WET
0 °
(Not drawn to scale)
28 The climate at 90° north latitude is dry because the air at that location is usually
(1) warm and rising
(3) cool and rising
(2) warm and sinking
(4) cool and sinking
29 The paths of the surface planetary winds are curved due to Earth’s
(1) revolution
(3) circumference
(2) rotation
(4) size
30 The tropopause is approximately how far above sea level?
(1) 12 mi
(3) 60 mi
(2) 12 km
(4) 60 km
31 The diagram below shows four magnified block-shaped sandstone samples labeled A, B, C, and D . Each
sandstone sample contains quartz grains of different shapes and sizes. The quartz grains are held together
by hematite cement.
Key
Quartz grains
Hematite cement
A
B
C
D
In which sample did the quartz grains undergo the most abrasion during erosional
transport?
(1) A
(3) C
(2) B
(4) D
P.S./E. Sci.–Jan. ’05
[6]
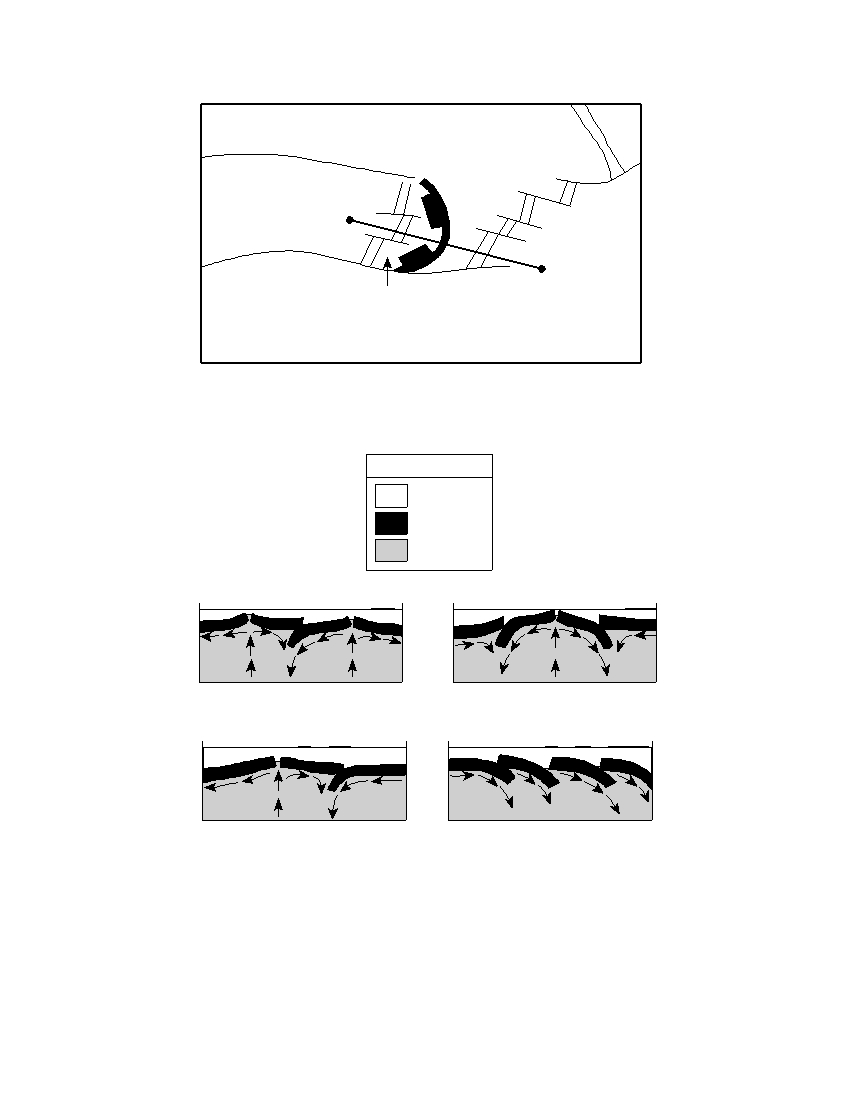
32 On the map below, line AB is drawn across several of Earth’s tectonic plates in the South Atlantic Ocean.
South American
Plate
Scotia
Plate
A
B
Sandwich
Plate
Antarctic
Plate
Which cross section best represents the plate boundaries and mantle movement beneath
line AB ?
Key
Ocean
Lithosphere
Mantle
A
B
A
B
( 1 )
( 3 )
A
B
A
B
( 2 )
( 4 )
P.S./E. Sci.–Jan. ’05
[7]
[OVER]
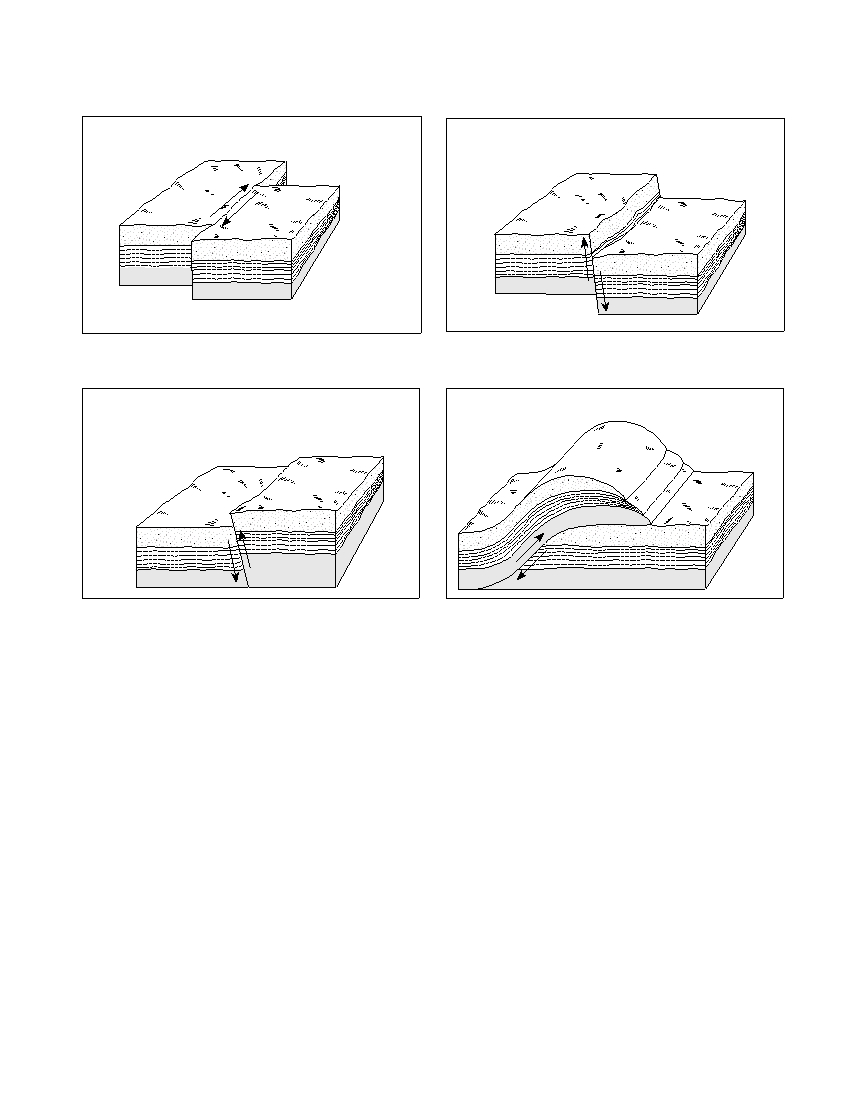
33 The diagrams below show four major types of fault motion occurring in Earth’s crust. Which type of fault
motion best matches the general pattern of crustal movement at California’s San Andreas fault?
Lateral Fault (shearing)
Normal Fault (tension)
( 1 )
( 3 )
Reverse Fault (compression)
Thrust Fault
( 2 )
( 4 )
P.S./E. Sci.–Jan. ’05
[8]
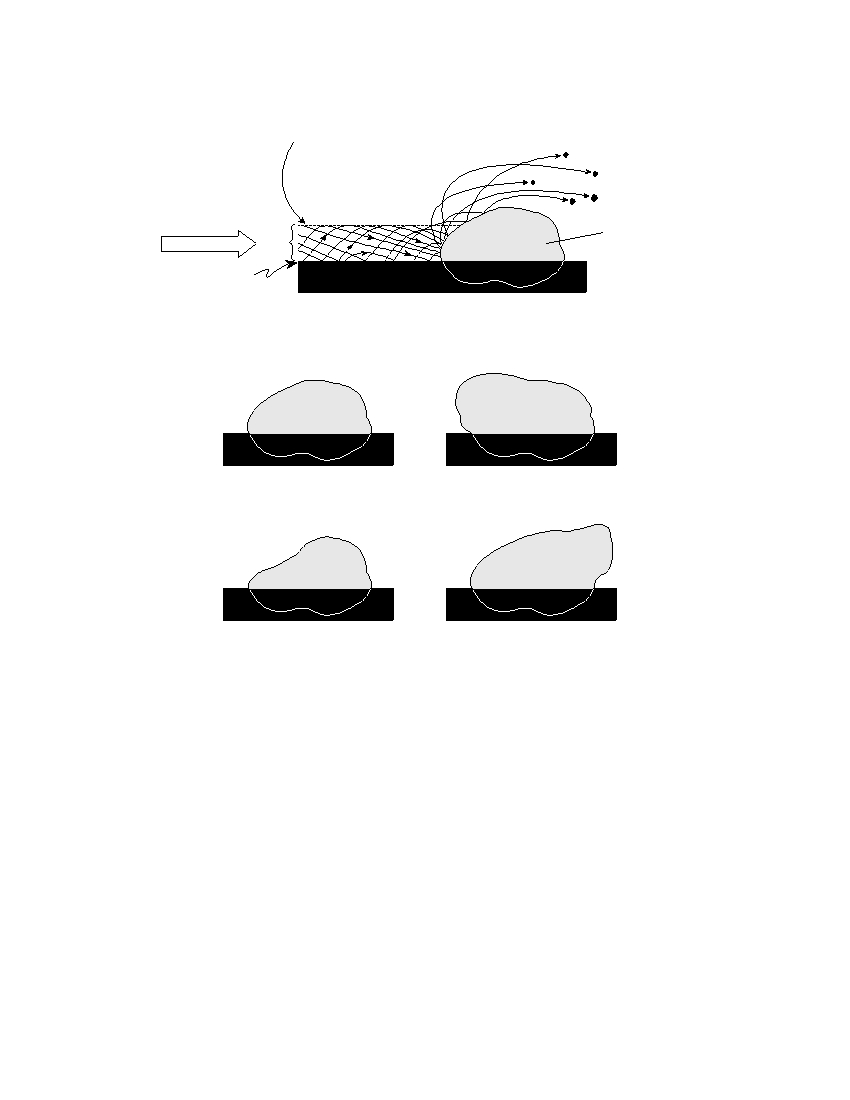
34 The cross section below shows the movement of wind-driven sand particles that strike a partly exposed
basalt cobble located at the surface of a windy desert.
Layer containing the most dense
wind-driven sediment
Basalt
Prevailing wind
3 in
cobble
Ground
surface
Which cross section best represents the appearance of this cobble after many years of
exposure to the wind-driven sand?
( 1 )
( 3 )
( 2 )
( 4 )
P.S./E. Sci.–Jan. ’05
[9]
[OVER]
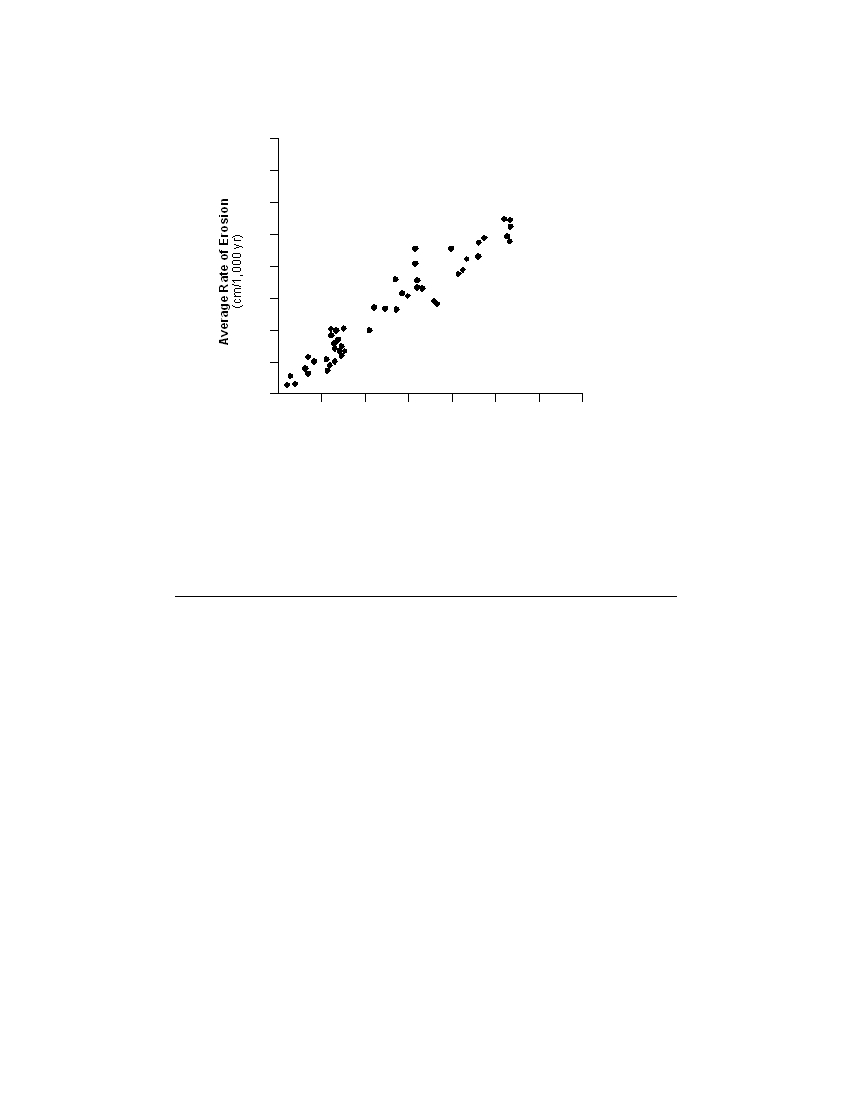
35 Each dot on the graph below shows the result of separate scientific studies of the relationship between the
rates of erosion in regions of different relief. Relief is the local difference between the highest and the
lowest elevations.
80
70
60
50
40
30
20
10
0
100
200
300
400
500
600
700
Relief (m)
The results of these combined studies indicate that with each 100-meter increase in
relief, the rate of erosion generally
(1) decreases at a rate of 10 cm/1,000 years
(2) decreases at a rate of 20 cm/1,000 years
(3) increases at a rate of 10 cm/1,000 years
(4) increases at a rate of 20 cm/1,000 years
P.S./E. Sci.–Jan. ’05
[10]
Part B–1
Answer all questions in this part.
Directions (36–50): For each statement or question, write on your separate answer sheet the number of the
word or expression that, of those given, best completes the statement or answers the question. Some questions
may require the use of the Earth Science Reference Tables .
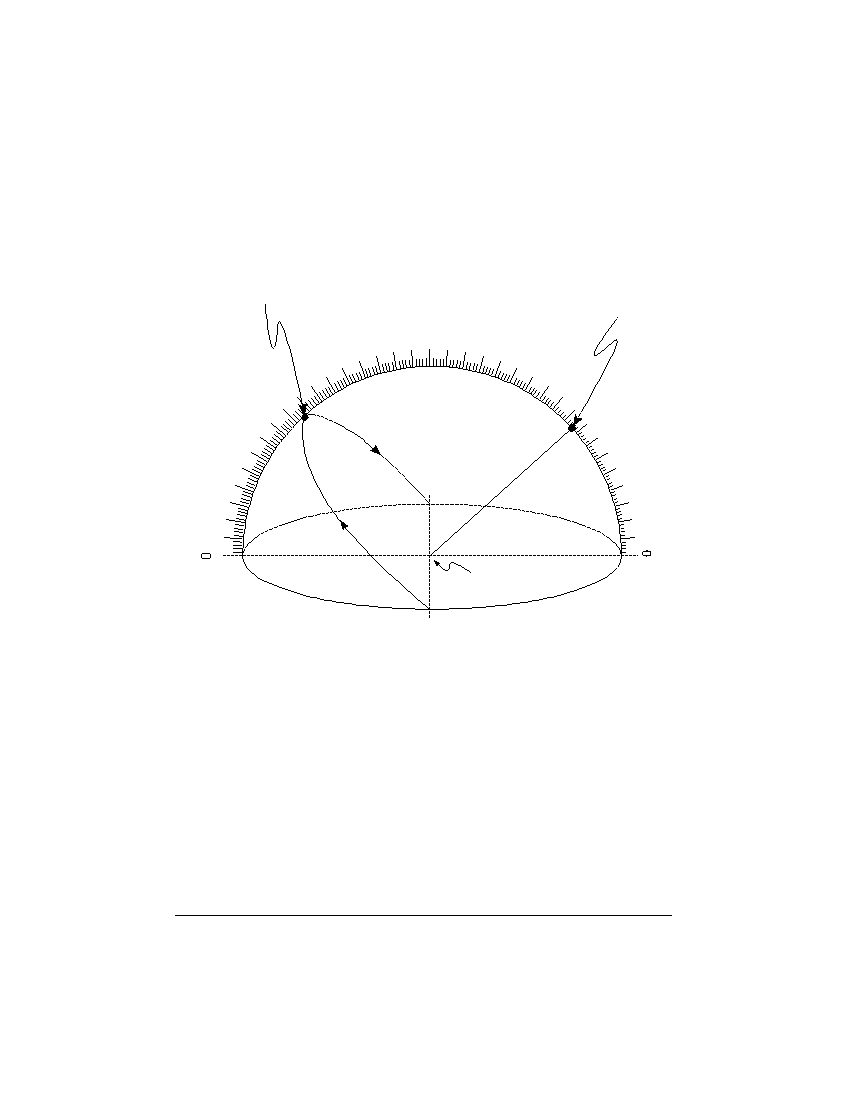
Base your answers to questions 36 through 38 on the diagram below, which represents a model of the sky
(celestial sphere) for an observer in New York State. The curved arrow represents the Sun’s apparent path for
part of one day. The altitude of Polaris is also indicated.
Solar noon
Polaris
80
90
80
70
70
60
60
50
50
Sun’
40
40
s
path
30
30
20
20
West
10
10
South
North
Observer
East
36 According to this diagram, what is the Sun’s altitude at solar noon?
(1) 23.5°
(3) 48°
(2) 42°
(4) 90°
37 Where is this observer most likely located?
(1) Massena
(3) Slide Mountain
(2) Oswego
(4) Mt. Marcy
38 On which date could this observation of the Sun’s apparent path have been made?
(1) March 21
(3) October 21
(2) July 21
(4) December 21
P.S./E. Sci.–Jan. ’05
[11]
[OVER]
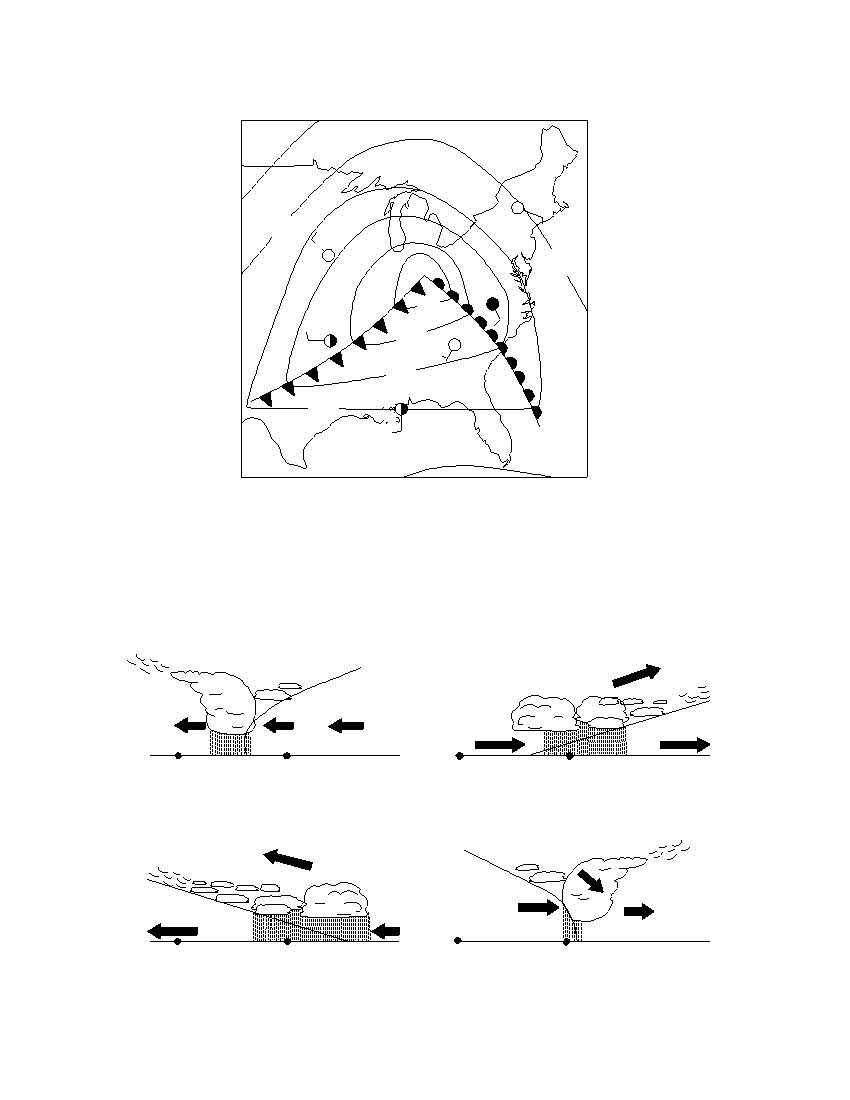
Base your answers to questions 39 through 42 on the weather map below. The map shows a low-pressure
system and some atmospheric conditions at weather stations A, B, and C .
71
55
cP
70 C
1012
50
L
82 B
996
82
82
1000 88
A
65
84
1004
mT
91
1008
86
39 Which type of weather is usually associated with a cP air mass, as shown near
weather station C ?
(1) moist and cool
(3) dry and cool
(2) moist and warm
(4) dry and warm
40 Which cross section best represents the air masses, air movement, clouds, and precipi-
tation occurring behind and ahead of the warm front located between stations A and B ?
Warm
air
Warm
Cool
Cool
air
air
air
A
B
A
B
( 1 )
( 3 )
Warm
air
Warm
Cool
Cool
air
air
air
A
B
A
B
( 2 )
( 4 )
P.S./E. Sci.–Jan. ’05
[12]

41 The arrows on which map best represent the direction of surface winds associated
with this low-pressure system?
Low
Low
( 1 )
( 3 )
Low
Low
( 2 )
( 4 )
42 If this weather system follows a normal storm track, the low-pressure center (L) will
generally move toward the
(1) northeast
(3) southeast
(2) northwest
(4) southwest
P.S./E. Sci.–Jan. ’05
[13]
[OVER]
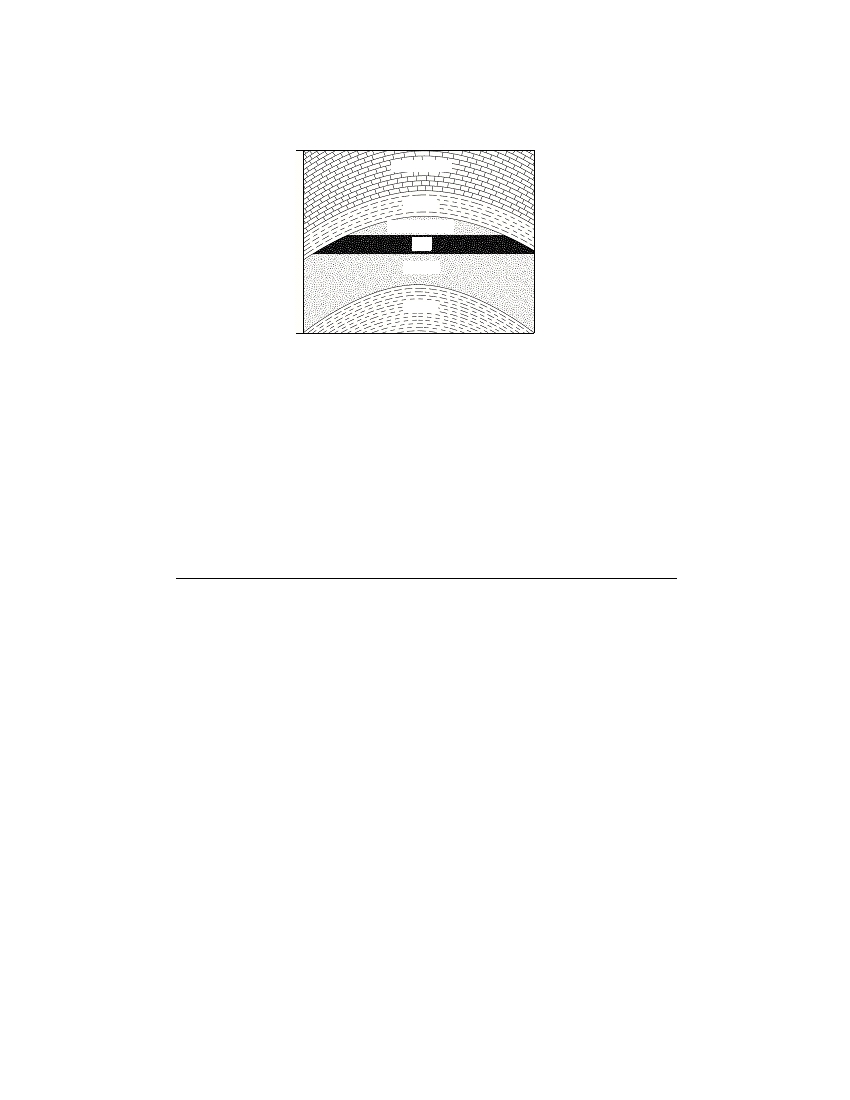
Base your answers to questions 43 and 44 on the bedrock cross section below. The cross section represents
part of Earth’s crust where natural gas, oil, and water have moved upward through a layer of folded sandstone
and filled the pore spaces at the top of the sandstone layer.
Top
Limestone
Shale
Natural gas
Oil
Water
Shale
Bottom
43 The final arrangement of the natural gas, oil, and water within the sandstone was
caused by differences in their
(1) density
(3) relative age
(2) specific heat
(4) radioactive half-life
44 The natural gas, oil, and water are trapped within the top of the sandstone and do
not move upward through the shale because, compared to the sandstone, the shale
has
(1) lower permeability
(3) larger pore spaces
(2) less foliation
(4) larger particles
P.S./E. Sci.–Jan. ’05
[14]
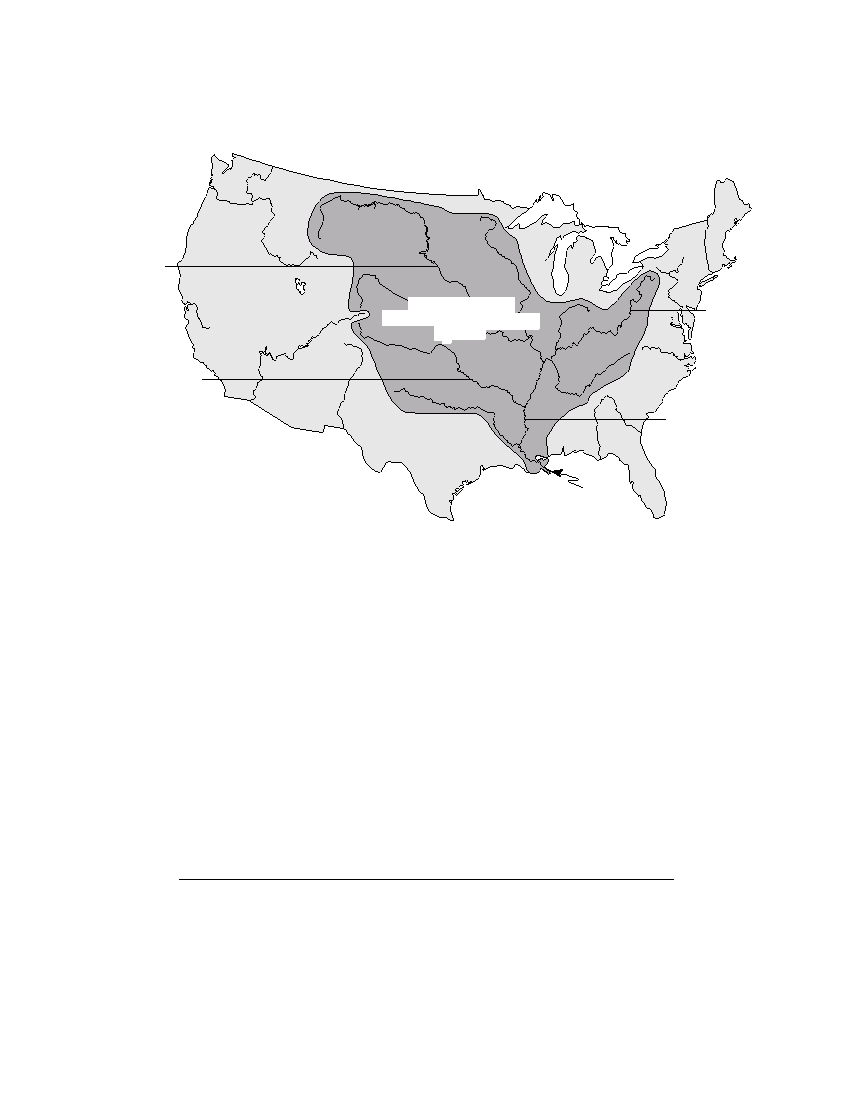
Base your answers to questions 45 through 47 on the map below, which shows the drainage basin of the
Mississippi River system. Several rivers that flow into the Mississippi River are labeled. The arrow at location X
shows where the Mississippi River enters the Gulf of Mexico.
Missouri River
Drainage Basin
of the Mississippi River
Ohio River
System
Arkansas River
Mississippi River
X
Gulf of Mexico
45 The entire land area drained by the Mississippi River system is referred to as a
(1) levee
(3) meander belt
(2) watershed
(4) floodplain
46 Sediments deposited at location X by the Missisippi River most likely have which
characteristics?
(1) angular fragments arranged as mixtures
(2) rock particles arranged in sorted beds
(3) rocks with parallel scratches and grooves
(4) high-density minerals with hexagonal crystals
47 The structure formed by the deposition of sediments at location X is best described
as a
(1) moraine
(3) delta
(2) tributary
(4) drumlin
P.S./E. Sci.–Jan. ’05
[15]
[OVER]
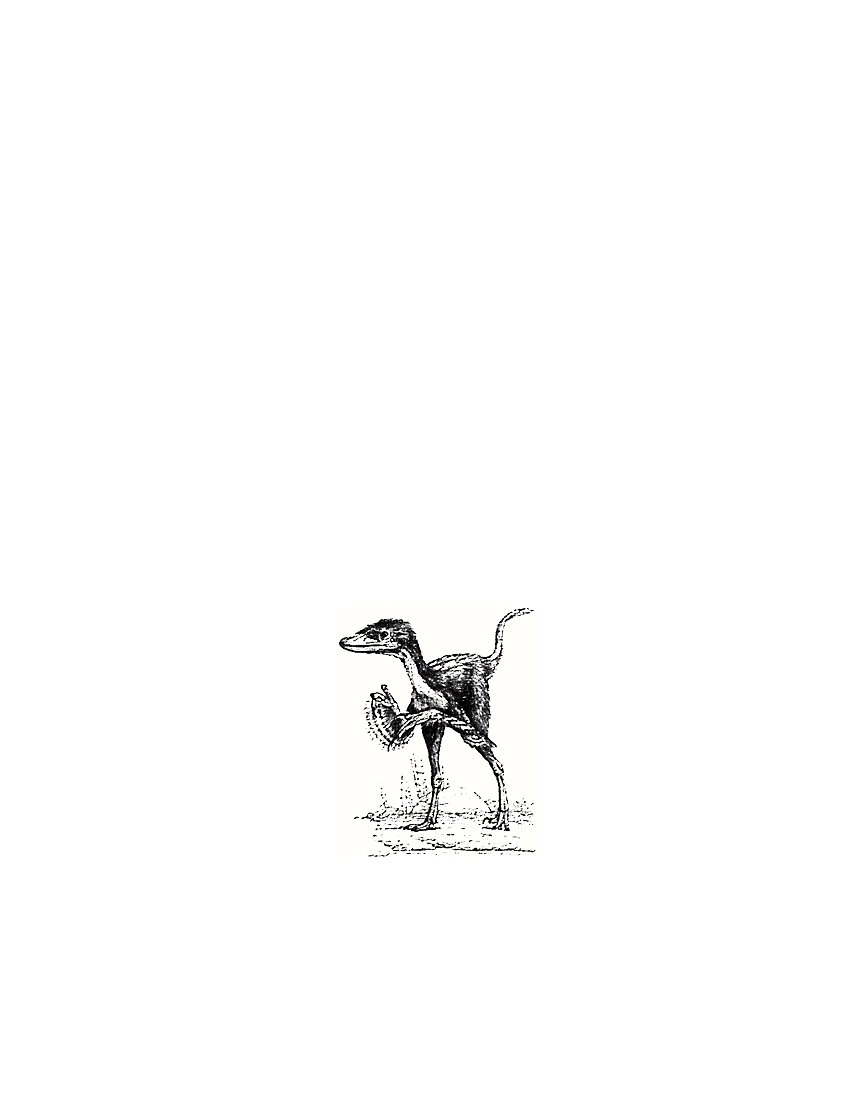
Base your answers to questions 48 through 50 on the reading passage and the drawing below and on your
knowledge of Earth science.
Fossil With Signs of Feathers Is Cited as Bird-Dinosaur Link
Paleontologists have discovered in China a fossil dinosaur with what are reported to be
clear traces of feathers from head to tail, the most persuasive evidence so far, scientists say,
that feathers predated the origin of birds and that modern birds are descendants of
dinosaurs.
Entombed in fine-grained rock, the unusually well-preserved skeleton resembles that
of a duck with a reptilian tail, altogether about three feet in length. Its head and tail are
edged with the imprint of downy fibers. The rest of the body, except for bare lower legs,
shows distinct traces of tufts and filaments that appear to have been primitive feathers. On
the backs of its short forelimbs are patterns of what look like modern bird feathers.
Other dinosaur remains with what appear to be featherlike traces have been unearthed
in recent years, but nothing as complete as this specimen, paleontologists said. Etched in
the rock like a filigree decoration surrounding the skeleton are imprints of where the down
and feathers appear to have been.
The 130-million-year-old fossils were found a year ago by farmers in Liaoning Province
in northeastern China. After an analysis by Chinese and American researchers, the fossil
animal was identified as a dromaeosaur, a small fast-running dinosaur related to veloci-
raptor. The dinosaurs belonged to a group of two-legged predators known as advanced
theropods . . .
excerpted from “Fossil With Signs of
Feathers Is Cited as Bird-Dinosaur Link”
John Noble Wilford
New York Times , April 26, 2001
The drawing below shows an artist’s view of the dinosaur, based on the fossilized
remains.
48 During which period of geologic time have paleontologists inferred that the
feathered dinosaur mentioned in the passage existed?
(1) Cambrian
(3) Paleogene
(2) Cretaceous
(4) Permian
P.S./E. Sci.–Jan. ’05
[16]

49 This feathered dinosaur is not considered an index fossil because it
(1) existed too long ago
(3) was a land-dwelling animal
(2) was preserved in ash
(4) was found in only one area
50 The reference to the bird-dinosaur link is most likely referring to the concept of
(1) plate tectonics
(3) dynamic equilibrium
(2) evolution
(4) recycling
P.S./E. Sci.–Jan. ’05
[17]
[OVER]

Part B–2
Answer all questions in this part.
Directions (51–62): Record your answers in the spaces provided in your answer booklet. Some questions
may require the use of the Earth Science Reference Tables.
Base your answers to questions 51 and 52 on the diagram provided in your answer booklet. The diagram
shows a model of Earth’s orbit around the Sun. Two motions of Earth are indicated. Distances to the Sun are
given for two positions of Earth in its orbit.
51 On the diagram provided in your answer booklet , place an X on Earth’s orbit to
indicate Earth’s position on May 21.
[ 1 ]
52 Explain why New York State experiences summer when Earth is at its greatest dis-
tance from the Sun.
[ 1 ]
Base your answers to questions 53 through 55 on the field map provided in your answer booklet . The map
shows elevations, measured in feet, of a number of points in a certain geographic region. Contour lines have
been drawn for the 100-foot and 120-foot elevations. Points A and B represent two spot elevations on the map.
53 On the map provided in your answer booklet, draw the 60-foot contour line. Make
sure that the contour line extends to the edges of the map.
[ 1 ]
54 Toward which general compass direction does Elma Creek flow? [ 1 ]
55 Calculate the gradient between points A and B . Label the answer with the correct
units.
[ 2 ]
56 On the weather map station model provided in your answer booklet , using the
proper format, record the six weather conditions shown below.
[ 2 ]
Wind: from the northwest
Wind speed: 10 knots
Barometric pressure: 1022.0 mb
Cloud cover: 50%
Visibility: 5 mi
Precipitation (in the past 6 hours): .45 in
P.S./E. Sci.–Jan. ’05
[18]
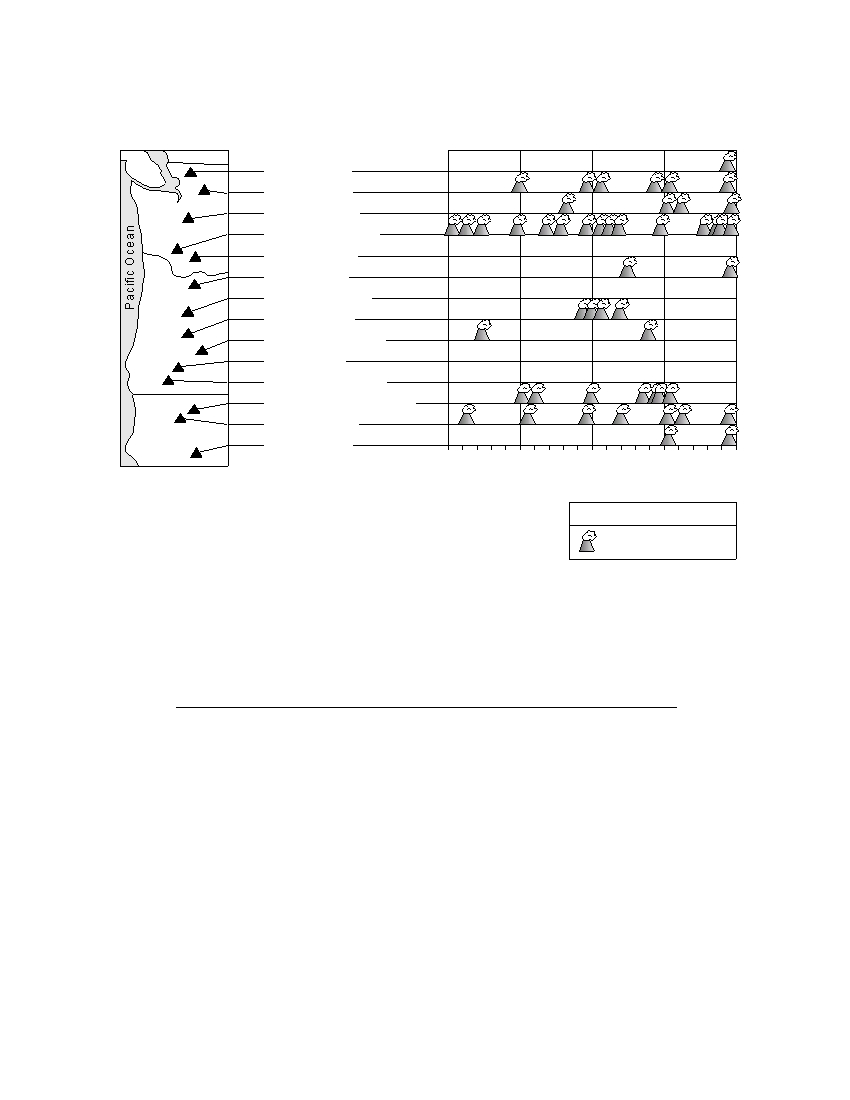
Base your answers to questions 57 and 58 on the map and table below. The map shows the name and
location of the volcanic peaks in the Cascade Mountain Range of the northwestern United States west of the
Yellowstone Hot Spot. The table shows the major eruptions of each peak over the past 4,000 years.
Mount Baker
Glacier Peak
Mount Rainier
Washington
Mount St. Helens
Mount Adams
Mount Hood
Mount Jefferson
Three Sisters
Newberry Volcano
Oregon
Crater Lake
Mount McLoughlin
Medicine Lake Volcano
Mount Shasta
California
Lassen Peak
4,000
3,000
2,000
1,000
0
Years before present
Key
Volcanic eruption
57 During which geologic epoch did the volcanic activity shown on the table occur?
[ 1 ]
58 On the cross section provided in your answer booklet, place an arrow in the
continental crust and an arrow in the oceanic crust to show the relative directions of
plate movement.
[ 1 ]
59 Which layer of Earth is composed of both the crust and the rigid mantle?
[ 1 ]
P.S./E. Sci.–Jan. ’05
[19]
[OVER]
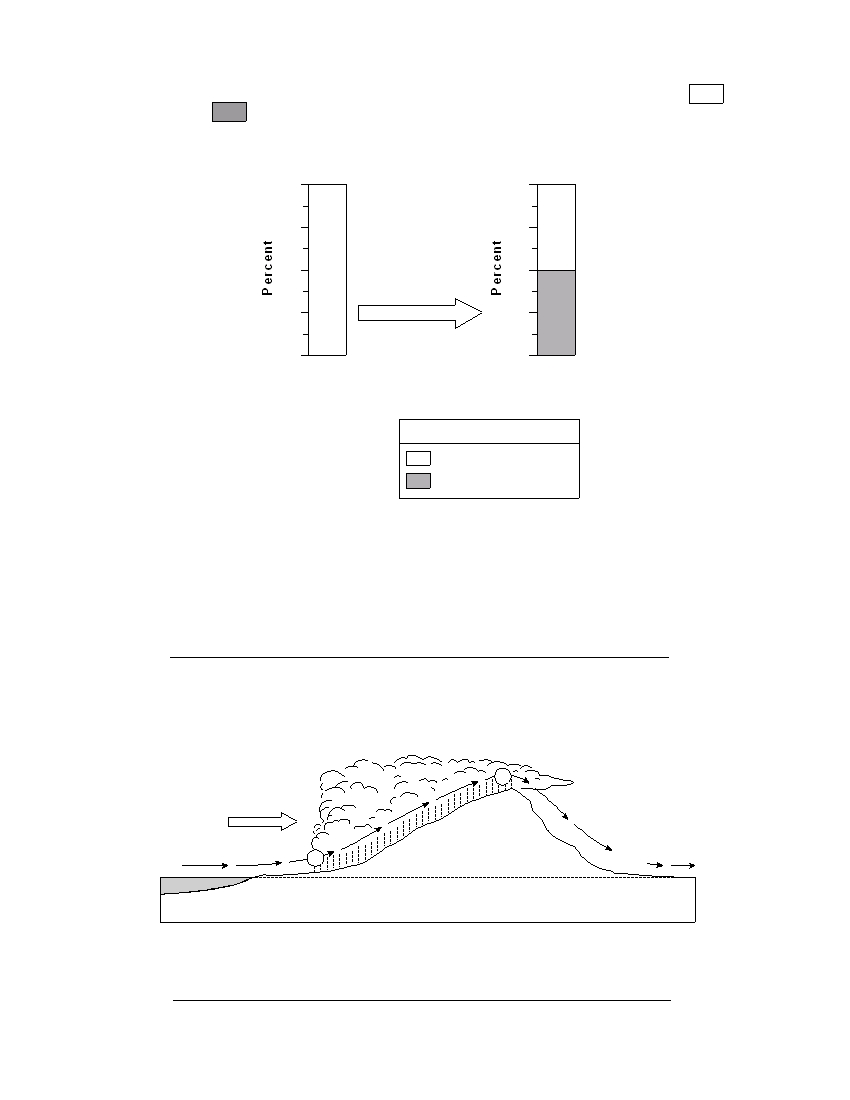
Base your answers to questions 60 and 61 on the diagram below, which represents a model of the radio-
active decay of a particular element. The diagram shows the decay of a radioactive element (
) into the
stable decay element (
) after one half-life period.
Radioactive Decay Model
100
100
75
75
50
50
Half-life period
25
25
0
0
Original Material
Material After One Half-Life
Key
Radioactive element
Stable decay element
60 On the diagram provided in your answer booklet, shade in the amount of stable
decay element present after the second half-life period.
[ 1 ]
61 If the radioactive element in this model is carbon-14, how much time will have
passed after one half-life?
[ 1 ]
62 The diagram below shows warm, moist air moving off the ocean and over a mountain,
causing precipitation between points 1 and 2.
Cold
Elevation
2
10,000 ft
10,000 ft
Warm,
moist air
2,000 ft
1
2,000 ft
Ocean
Sea level
Describe two changes that occur to the warm, moist air between points 1 and 2 that
would cause cloud formation.
[ 2 ]
P.S./E. Sci.–Jan. ’05
[20]

Part C
Answer all questions in this part.
Directions (63–80): Record your answers in the spaces provided in your answer booklet. Some questions
may require the use of the Earth Science Reference Tables.
Base your answers to questions 63 through 65 on the reading passage below and on your knowledge of
Earth science.
The Blue Moon
A “Blue Moon” is the name given to the second full moon in a calendar month. Because
there are roughly 29.5 days between full moons, it is unusual for two full moons to “fit” into
a 30 or 31 day month (and impossible to fit into a 28 or 29 day month, so February can
never have a Blue Moon). The saying “Once in a Blue Moon” means a rare occurrence, and
predates the current astronomical use of the term, which is quite recent. In fact, Blue
Moons are not all that rare, on average there will be one Blue Moon every 2.5 years. After
1999, the next Blue Moons will be in November 2001; July 2004; and June 2007. The last
one before 1999 was in July 1996.
The term Blue Moon is believed to have originated in 1883 after the eruption of
Krakatoa. The volcano put so much dust in the atmosphere that the Moon actually looked
blue in color. This was so unusual that the term “once in a Blue Moon” was coined.
“The Blue Moon”
David R. Williams
nssdc.gsfc.nasa.gov/planetary/lunar/blue_moon.html
63 Explain why a Blue Moon never occurs during the month of February.
[ 1 ]
64 What is the greatest number of full-Moon phases, visible from Earth, that are
possible in a span of 1 year?
[ 1 ]
65 In the space provided in your answer booklet, draw the relative positions of Earth, the
Moon, and the Sun, as viewed from space, so that a full-Moon phase would be visible
to an observer on Earth. Label Earth, the Moon, and the Sun in your drawing.
[ 1 ]
66 The Moon has many more impact craters visible on its surface than Earth has on its
surface. State two reasons that Earth has so few visible impact craters. [ 2 ]
P.S./E. Sci.–Jan. ’05
[21]
[OVER]
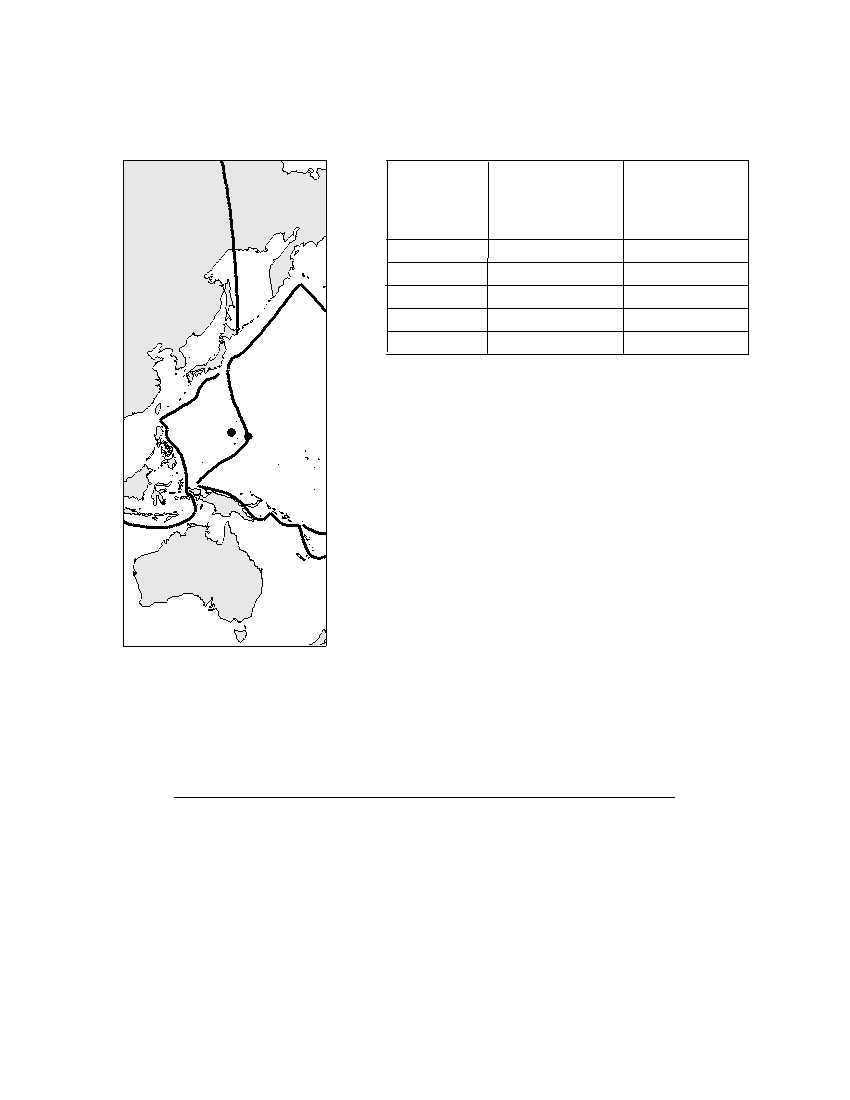
Base your answers to questions 67 and 68 on the map and data table shown below. The map shows some
tectonic plates and the boundaries between them. Letters A and B are locations on Earth’s surface. The data
table shows the depth below Earth’s surface of five earthquakes measured from location A toward location B .
Map
Data Table
Distance from
Depth Below
Earthquake
Location A
Earth’s Surface
Eurasian
Toward Location B
(km)
Plate
(km)
1
100
600
2
200
400
3
250
300
4
300
250
5
400
60
A
B
Indian-Australian
Plate
67 On the grid provided in your answer booklet, plot the depths of the five earthquakes
from location A toward location B .
[ 1 ]
68 Identify the type of plate boundary or geologic feature found at location B .
[ 1 ]
P.S./E. Sci.–Jan. ’05
[22]
Base your answers to questions 69 through 71 on the cross section below, which shows several rock
formations found in New York State. The rock layers have not been overturned.
Hammer Creek
conglomerate
Basalt flow
Contact metamorphism
Brunswick sandstone
Palisade Sill
(igneous intrusion)
Lockatong siltstone
formation containing
Coelophysis footprints
Stockton sandstone
69 How does this cross section indicate that the Stockton sandstone is the oldest rock
layer?
[ 1 ]
70 State one piece of evidence that supports the fact that the Palisade Sill is younger
than the Brunswick sandstone.
[ 1 ]
71 State one tectonic event affecting North America that occurred at the same time as
the Palisade Sill intrusion.
[ 1 ]
P.S./E. Sci.–Jan. ’05
[23]
[OVER]
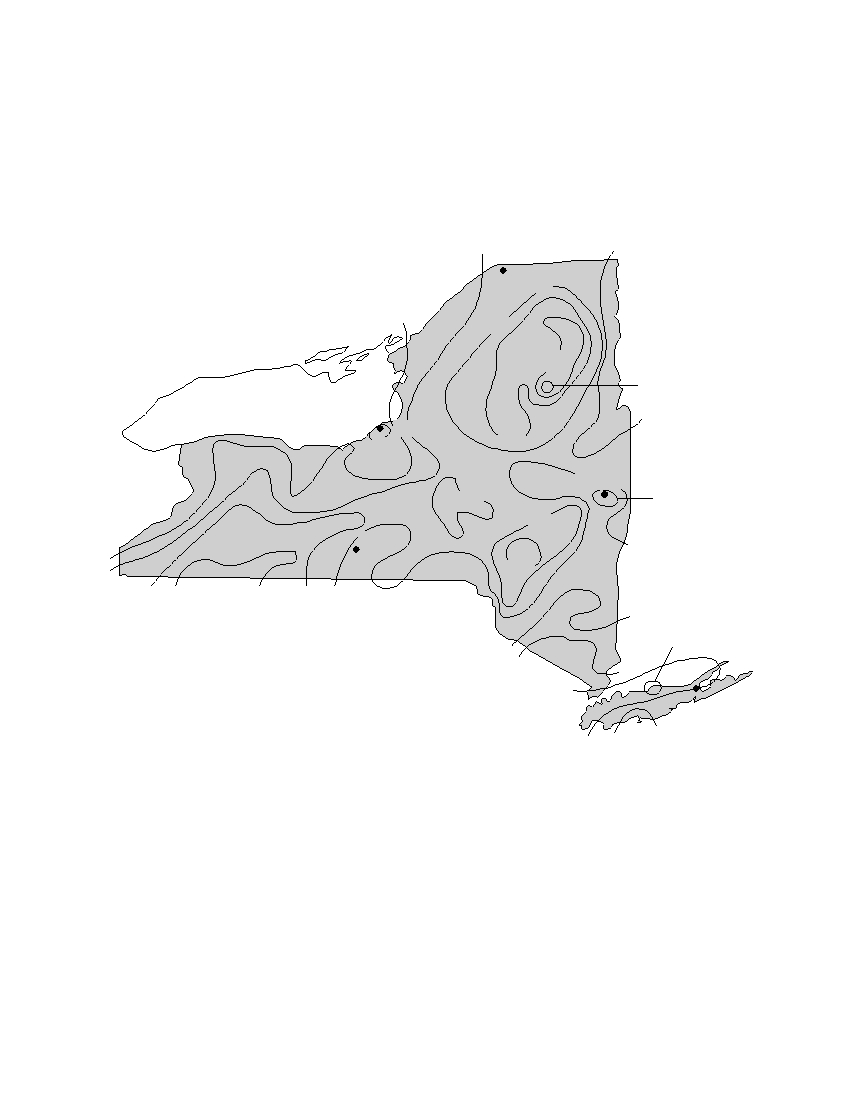
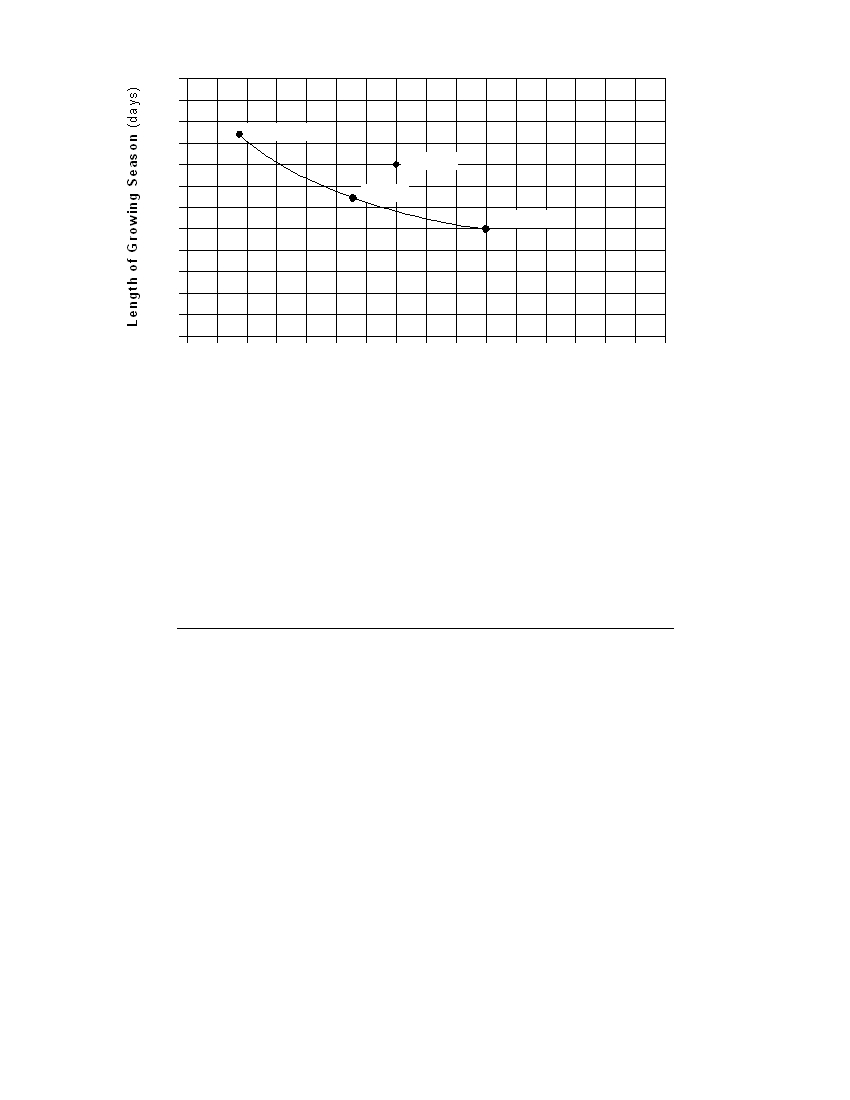
Base your answers to questions 72 through 74 on the map below, the graph on the next page, and your
knowledge of Earth science. The map shows the length of the growing season in New York State, expressed in
days. The growing season is the average number of days between the last frost in spring and the first frost in fall.
The graph line shows the relationship between the latitudes of Riverhead, New York; Albany, New York; and
Massena, New York; and the length of the growing season at these three locations.
Length of Growing Season (in days)
150
150
Massena
165
135
105
90
Lake Ontario
150
Oswego
180
120
Albany
135
165
135
Elmira
150
165
120
150
135 120
120
135 150
165
210
165
180
195
Riverhead
180
195
P.S./E. Sci.–Jan. ’05
[24]
220
200
Riverhead
180
Oswego
Albany
160
Massena
140
120
100
40 ° N
41 ° N
42 ° N
43 ° N
44 ° N
45 ° N
46 ° N
47 ° N
48 ° N
Latitude of Cities (degrees)
72 For Riverhead, Albany, and Massena, state the relationship between latitude and the
length of the growing season shown by the graph.
[ 1 ]
73 The data for Oswego, New York, have been plotted separately on the graph. Explain
why the location of Oswego causes it to have a growing season longer than other
cities at the same latitude.
[ 1 ]
74 Compare the length of the growing season in a lowland region with the length of the
growing season in a mountain region at approximately the same latitude.
[ 1 ]
P.S./E. Sci.–Jan. ’05
[25]
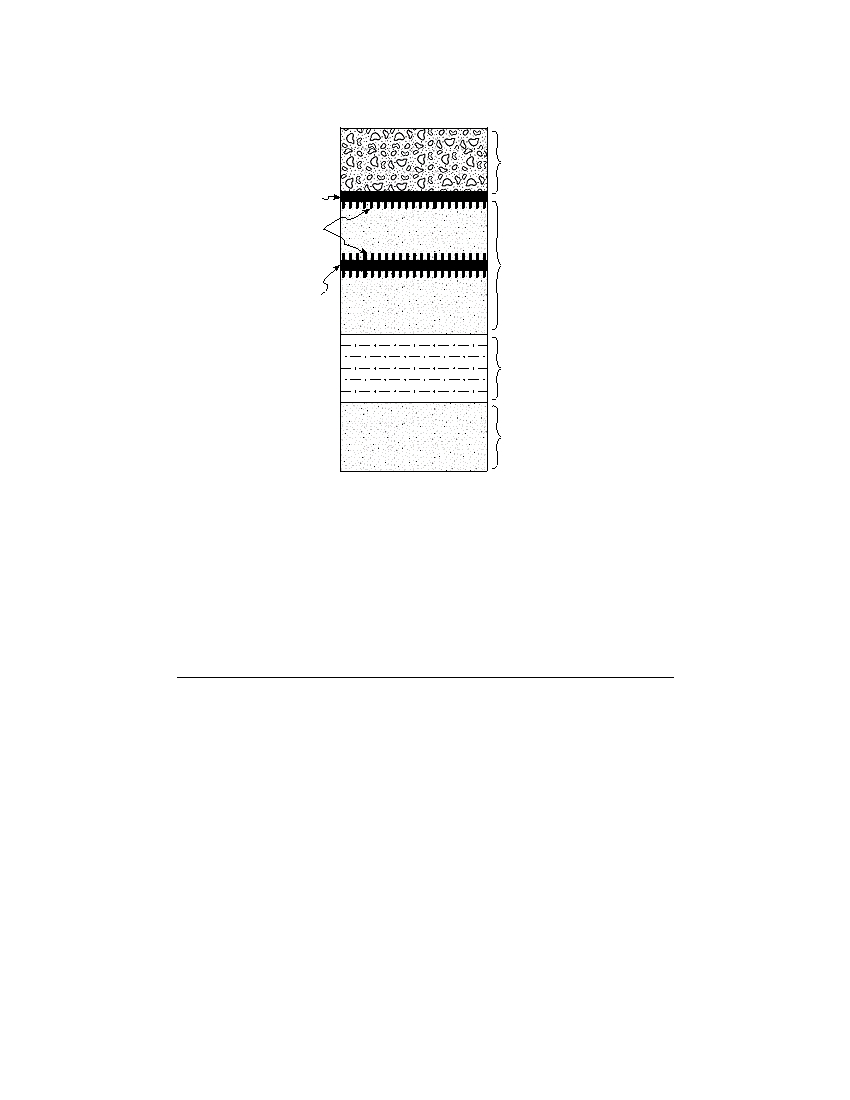
Base your answers to questions 75 through 77 on the cross section below and on your knowledge of Earth
science. The cross section shows a portion of Earth’s crust. The age, in millions of years, of each boundary
between the different sedimentary rock layers is shown. The age of boundary X between the sedimentary rock
and the metamorphic rock is not shown. Assume no overturning has occurred.
Age
(millions
of years)
4,000 meters
323
above sea level
362
418
Sedimentary
443
rock layers
Boundary X
Metamorphic
rock
Sea level
75 Identify the geologic feature represented by boundary X .
[ 1 ]
76 Describe how the rock type below boundary X was formed.
[ 1 ]
77 Identify by name one index fossil that existed when the limestone rock shown in the
cross section was being formed.
[ 1 ]
Base your answers to questions 78 through 80 on the diagram and table below. The diagram represents a
felsic igneous rock. Letters A, B, and C represent three different minerals in the rock sample. The table
describes the physical properties of minerals A, B, and C found in the igneous rock sample.
A
B
A
B
C
C
(Actual size)
Mineral
Key
Physical Properties
A
pink, cleaves in two directions at 90 °
B
white, cleaves in two directions, striations visible
C
colorless or clear with a glassy luster
78 State the texture of this igneous rock.
[ 1 ]
79 On the table provided in your answer booklet, state the names of minerals A, B, and C . [ 2 ]
80 State two processes responsible for the formation of an igneous rock.
[ 1 ]
P.S./E. Sci.–Jan. ’05
[26]

The University of the State of New York
R EGENTS H IGH S CHOOL E XAMINATION
PHYSICAL SETTING
EARTH SCIENCE
Wednesday, January 26, 2005 — 1:15 to 4:15 p.m., only
ANSWER SHEET
Student . . . . . . . . . . . . . . . . . . . . . . . . . . . . . . . . . . . . . . . . . . . . . . .
Sex:
■ Male ■ Female
Grade . . . . . . . . . . . .
Teacher . . . . . . . . . . . . . . . . . . . . . . . . . . . . . . . . . . . . . . . . . . . . . . .
School . . . . . . . . . . . . . . . . . . . . . . . . . . . . . . . . . . . .
Record your answers to Part A and Part B–1 on this answer sheet.
Part A
Part B–1
1 . . . . . . . . . . . .
13 . . . . . . . . . . . .
25 . . . . . . . . . . . .
36 . . . . . . . . . . . .
44 . . . . . . . . . . . .
2 . . . . . . . . . . . .
14 . . . . . . . . . . . .
26 . . . . . . . . . . . .
37 . . . . . . . . . . . .
45 . . . . . . . . . . . .
3 . . . . . . . . . . . .
15 . . . . . . . . . . . .
27 . . . . . . . . . . . .
38 . . . . . . . . . . . .
46 . . . . . . . . . . . .
4 . . . . . . . . . . . .
16 . . . . . . . . . . . .
28 . . . . . . . . . . . .
39 . . . . . . . . . . . .
47 . . . . . . . . . . . .
5 . . . . . . . . . . . .
17 . . . . . . . . . . . .
29 . . . . . . . . . . . .
40 . . . . . . . . . . . .
48 . . . . . . . . . . . .
6 . . . . . . . . . . . .
18 . . . . . . . . . . . .
30 . . . . . . . . . . . .
41 . . . . . . . . . . . .
49 . . . . . . . . . . . .
7 . . . . . . . . . . . .
19 . . . . . . . . . . . .
31 . . . . . . . . . . . .
42 . . . . . . . . . . . .
50 . . . . . . . . . . . .
Part B–1 Score
8 . . . . . . . . . . . .
20 . . . . . . . . . . . .
32 . . . . . . . . . . . .
43 . . . . . . . . . . . .
9 . . . . . . . . . . . .
21 . . . . . . . . . . . .
33 . . . . . . . . . . . .
10 . . . . . . . . . . . .
22 . . . . . . . . . . . .
34 . . . . . . . . . . . .
11 . . . . . . . . . . . .
23 . . . . . . . . . . . .
35 . . . . . . . . . . . .
Part A Score
12 . . . . . . . . . . . .
24 . . . . . . . . . . . .
Write your answers to Part B–2 and Part C in your answer booklet.
The declaration below should be signed when you have completed the examination.
I do hereby affirm, at the close of this examination, that I had no unlawful knowledge of the questions or answers prior to
the examination and that I have neither given nor received assistance in answering any of the questions during the examination.
Signature

PS/EARTH SCIENCE
E C N E I C S H T R A E / S P