
PS/EARTH SCIENCE
The University of the State of New York
REGENTS HIGH SCHOOL EXAMINATION
PHYSICAL SETTING
EARTH SCIENCE
Tuesday, June 20, 2006 — 9:15 a.m. to 12:15 p.m., only
This is a test of your knowledge of Earth science. Use that knowledge to answer
all questions in this examination. Some questions may require the use of the Earth
Science Reference Tables. The Earth Science Reference Tables are supplied separately.
Be certain you have a copy of the 2001 edition of these reference tables before you
begin the examination.
Your answer sheet for Part A and Part B–1 is the last page of this examination
booklet. Turn to the last page and fold it along the perforations. Then, slowly and
carefully, tear off your answer sheet and fill in the heading.
The answers to the questions in Part B–2 and Part C are to be written in your
separate answer booklet. Be sure to fill in the heading on the front of your answer
booklet.
You are to answer all questions in all parts of this examination according to the
directions provided in the examination booklet. Record your answers to the Part A
and Part B–1 multiple-choice questions on your separate answer sheet. Write your
answers to the Part B–2 and Part C questions in your answer booklet. All work should
be written in pen, except for graphs and drawings, which should be done in pencil.
You may use scrap paper to work out the answers to the questions, but be sure to
record all your answers on your separate answer sheet and in your answer booklet.
When you have completed the examination, you must sign the statement printed
at the end of your separate answer sheet, indicating that you had no unlawful
knowledge of the questions or answers prior to the examination and that you have
neither given nor received assistance in answering any of the questions during the
examination. Your answer sheet and answer booklet cannot be accepted if you fail to
sign this declaration.
Notice. . .
A four-function or scientific calculator and a copy of the 2001 Earth Science Reference Tables
must be available for you to use while taking this examination.
The use of any communications device is strictly prohibited when taking this
examination. If you use any communications device, no matter how briefly, your
examination will be invalidated and no score will be calculated for you.
DO NOT OPEN THIS EXAMINATION BOOKLET UNTIL THE SIGNAL IS GIVEN.
E C N E I C S H T R A E / S P
Part A
Answer all questions in this part.
Directions (1–35): For each statement or question, write on your separate answer sheet the number of the
word or expression that, of those given, best completes the statement or answers the question. Some questions
may require the use of the Earth Science Reference Tables .
1 Which object is closest to Earth?
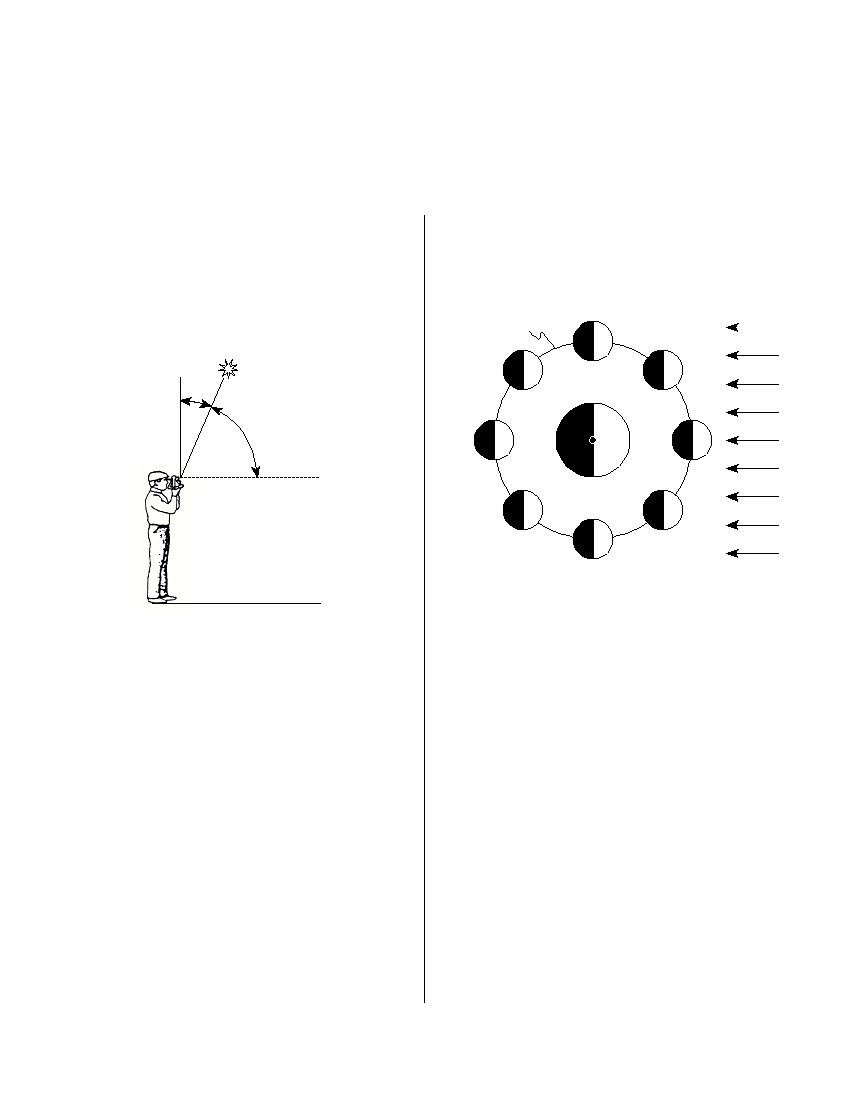
5 The diagram below shows the Moon orbiting
(1) the Sun
(3) the Moon
Earth, as viewed from space above Earth’s North
(2) Venus
(4) Mars
Pole. The Moon is shown at eight positions in its
orbit.
2 The diagram below shows an observer on Earth
Moon’s
3
measuring the altitude of Polaris .
orbit
4
2
Zenith
Polaris
23.5 °
Earth
66.5 °
5
North
1
Sun’s
Pole
rays
Horizon
6
8
7
(Not drawn to scale)
What is the latitude of this observer?
Spring ocean tides occur when the difference in
height between high tide and low tide is greatest.
(1) 90° N
(3) 43° N
At which two positions of the Moon will spring
(2) 66.5° N
(4) 23.5° N
tides occur on Earth?
(1) 1 and 5
(3) 3 and 7
3 What is the minimum water velocity needed in a
(2) 2 and 6
(4) 4 and 8
stream to maintain the transportation of the
smallest boulder?
6 Compared to other groups of stars, the group that
(1) 100 cm/sec
(3) 300 cm/sec
has relatively low luminosities and relatively low
(2) 200 cm/sec
(4) 500 cm/sec
temperatures is the
(1) Red Dwarfs
(3) Red Giants
4 Earth’s early atmosphere formed during the
(2) White Dwarfs
(4) Blue Supergiants
Early Archean Era. Which gas was generally
absent from the atmosphere at that time?
7 Which sequence correctly lists the relative sizes
(1) water vapor
(3) nitrogen
from smallest to largest?
(2) carbon dioxide
(4) oxygen
(1) our solar system, universe, Milky Way Galaxy
(2) our solar system, Milky Way Galaxy, universe
(3) Milky Way Galaxy, our solar system, universe
(4) Milky Way Galaxy, universe, our solar system
P.S./E. Sci.–June ’06
[2]
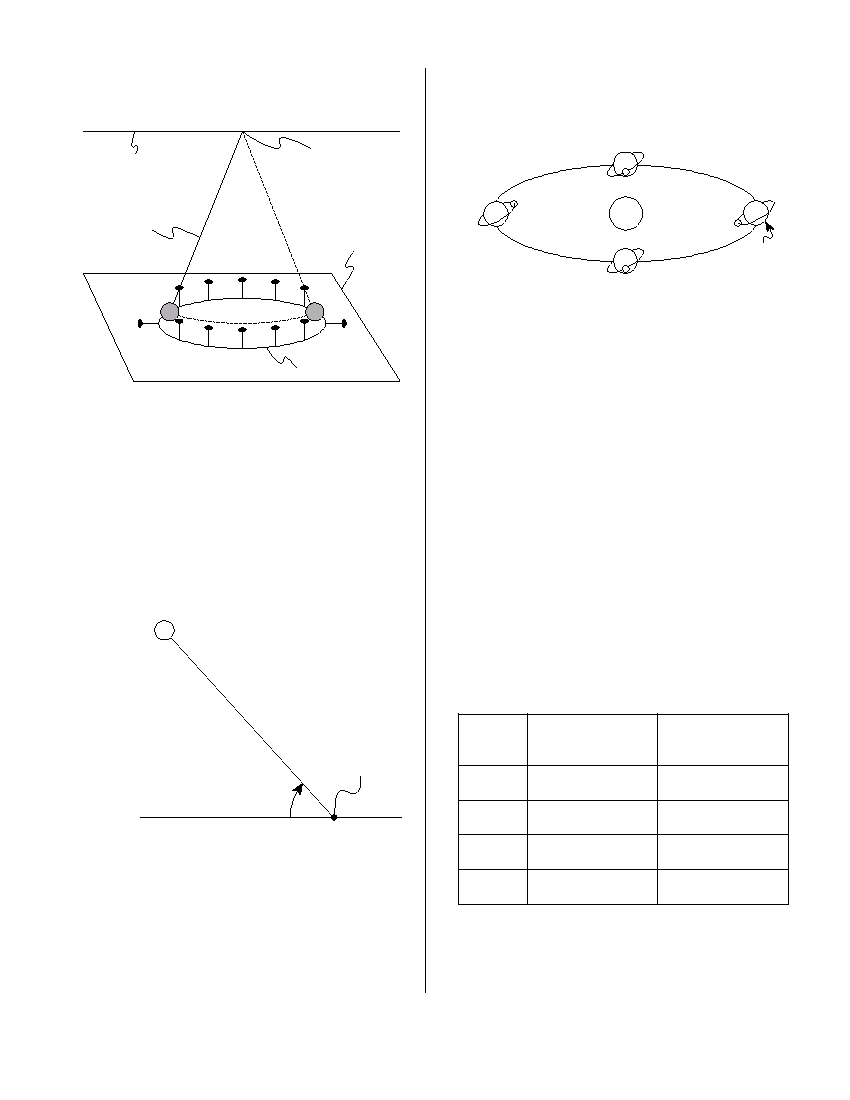
8 The diagram below represents a swinging
10 The diagram below shows Earth’s orbit around
Foucault pendulum.
the Sun and different positions of the Moon as it
travels around Earth. Letters A through D repre-
sent four different positions of the Moon.
Pivotal point
Ceiling of room
of attachment
D
A
Swinging
Sun
C
pendulum
Floor
Earth
B
(Not drawn to scale)
An eclipse of the Moon is most likely to occur
Ring of pegs
when the Moon is at position
(1) A
(3) C
(2) B
(4) D
This pendulum will show an apparent change in
the direction of its swing due to Earth’s
11 In the Northern Hemisphere, planetary winds
(1) curved surface
(3) rotation
blowing from north to south are deflected, or
(2) tilted axis
(4) revolution
curved, toward the west. This deflection is caused
by the
9 The diagram below shows the altitude of the Sun
(1) unequal heating of land and water surfaces
at solar noon on March 21, as seen by an observer
(2) movement of low-pressure weather systems
at 42° N latitude.
(3) orbiting of Earth around the Sun
(4) spinning of Earth on its axis
March 21
Sun
12 The table below shows air-pressure readings
taken at two cities, in the same region of the
United States, at noon on four different days.
Air-Pressure Readings
Observer
Day
City A
City B
located
Air Pressure (mb)
Air Pressure (mb)
at 42 ° N
1
1004.0
1004.0
Horizon
48 °
2
1000.1
1002.9
3
1000.2
1011.1
Compared to the altitude of the Sun observed at
solar noon on March 21, the altitude of the Sun
4
1010.4
1012.3
observed at solar noon on June 21 will be
(1) 15° higher in the sky
The wind speed in the region between cities A
(2) 23.5° higher in the sky
and B was probably the greatest at noon on day
(3) 42° higher in the sky
(1) 1
(3) 3
(4) 48° higher in the sky
(2) 2
(4) 4
P.S./E. Sci.–June ’06
[3]
[OVER]
13 If the base of a cloud is located at an altitude of
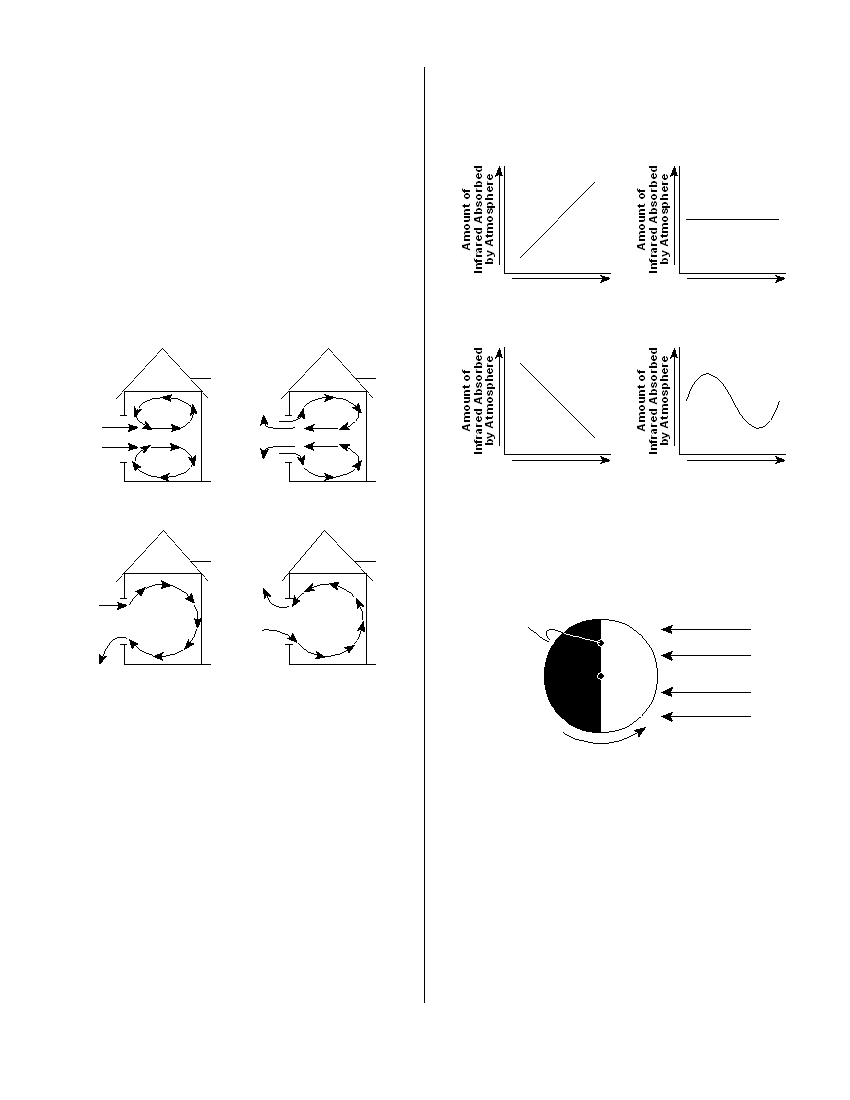
17 Which graph best shows the relationship between
2 kilometers and the top of the cloud is located at
the concentration of carbon dioxide in Earth’s
an altitude of 8 kilometers, this cloud is located in
atmosphere and the amount of infrared radiation
the
absorbed by the atmosphere?
(1) troposphere, only
(2) stratosphere, only
(3) troposphere and stratosphere
(4) stratosphere and mesosphere
14 On a day with no wind, the air temperature outside
a house is 10°C. The air temperature inside the
house is 18°C. Which diagram best represents the
Concentration of
Concentration of
Carbon Dioxide
Carbon Dioxide
air circulation pattern that is most likely to occur
when a window of the house is first opened?
( 1 )
( 3 )
Roof
Roof
10 ° C
18 ° C
10 ° C
18 ° C
Concentration of
Concentration of
Floor
Floor
Carbon Dioxide
Carbon Dioxide
( 1 )
( 3 )
( 2 )
( 4 )
18 The diagram below represents the direction of
Roof
Roof
Earth’s rotation as it appears from above the North
Pole. Point X is a location on Earth’s surface.
10 ° C
18 ° C
10 ° C
18 ° C
Point X
Floor
Floor
Sun’s
( 2 )
( 4 )
North
rays
Pole
15 Most of the Gulf Stream Ocean Current is
(1) warm water that flows southwestward
Direction of rotation
(2) warm water that flows northeastward
(3) cool water that flows southwestward
The time at point X is closest to
(4) cool water that flows northeastward
(1) 6 a.m.
(3) 6 p.m.
(2) 12 noon
(4) 12 midnight
16 Which event is the best example of erosion?
(1) breaking apart of shale as a result of water
19 Snowfall is rare at the South Pole because the air
freezing in a crack
over the South Pole is usually
(2) dissolving of rock particles on a limestone
(1) rising and moist
(3) sinking and moist
gravestone by acid rain
(2) rising and dry
(4) sinking and dry
(3) rolling of a pebble along the bottom of a
stream
(4) crumbling of bedrock in one area to form soil
P.S./E. Sci.–June ’06
[4]
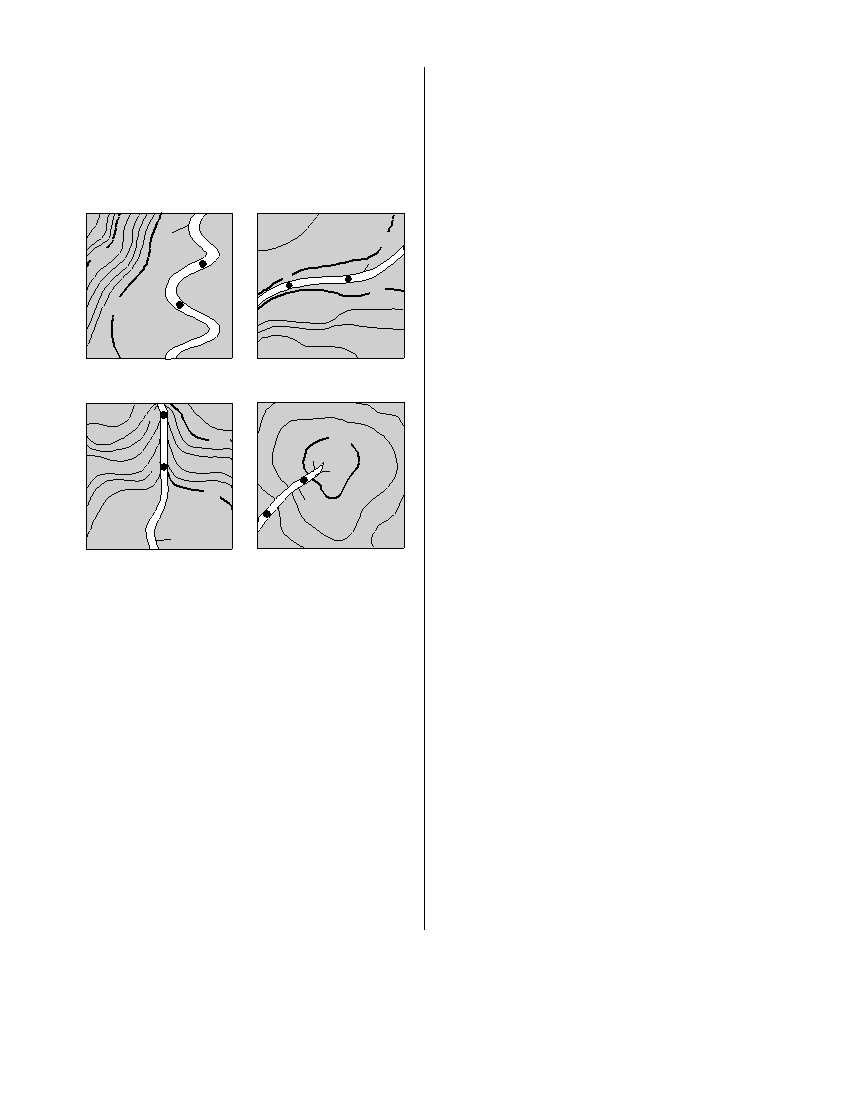
20 The four streams shown on the topographic maps
23 Which characteristic is most useful in correlating
below have the same volume between X and Y .
Devonian-age sedimentary bedrock in New York
The distance from X to Y is also the same. All the
State with Devonian-age sedimentary bedrock in
maps are drawn to the same scale and have the
other parts of the world?
same contour interval. Which map shows the
(1) color
(3) rock types
stream with the greatest velocity between points
(2) index fossils
(4) particle size
X and Y ?
24 A seismic station 4000 kilometers from the epi-
Stream
50
center of an earthquake records the arrival time
100
X
of the first P -wave at 10:00:00. At what time did
Y
Stream
X
the first S -wave arrive at this station?
Y
50
(1) 9:55:00
(3) 10:07:05
50
(2) 10:05:40
(4) 10:12:40
25 Which statement correctly describes the density
( 1 )
( 3 )
of Earth’s mantle compared to the density of
Earth’s core and crust?
X
(1) The mantle is less dense than the core but
100
100
more dense than the crust.
(2) The mantle is less dense than both the core
Y
X
and the crust.
50
(3) The mantle is more dense than the core but
Y Stream
less dense than the crust.
(4) The mantle is more dense than both the core
Stream
and the crust.
( 2 )
( 4 )
26 Convection currents in the plastic mantle are
21 A student obtains a cup of quartz sand from a
believed to cause divergence of lithospheric
beach. A saltwater solution is poured into the
plates at the
sand and allowed to evaporate. The mineral
(1) Peru-Chile Trench
residue from the saltwater solution cements the
(2) Mariana Trench
sand grains together, forming a material that is
(3) Canary Islands Hot Spot
most similar in origin to
(4) Iceland Hot Spot
(1) an extrusive igneous rock
(2) an intrusive igneous rock
27 According to fossil evidence, which sequence
(3) a clastic sedimentary rock
shows the order in which these four life-forms
(4) a foliated metamorphic rock
first appeared on Earth?
(1) reptiles → amphibians → insects → fish
22 Which coastal area is most likely to experience a
(2) insects → fish → reptiles → amphibians
severe earthquake?
(3) amphibians → reptiles → fish → insects
(1) east coast of North America
(4) fish → insects → amphibians → reptiles
(2) east coast of Australia
(3) west coast of Africa
(4) west coast of South America
P.S./E. Sci.–June ’06
[5]
[OVER]
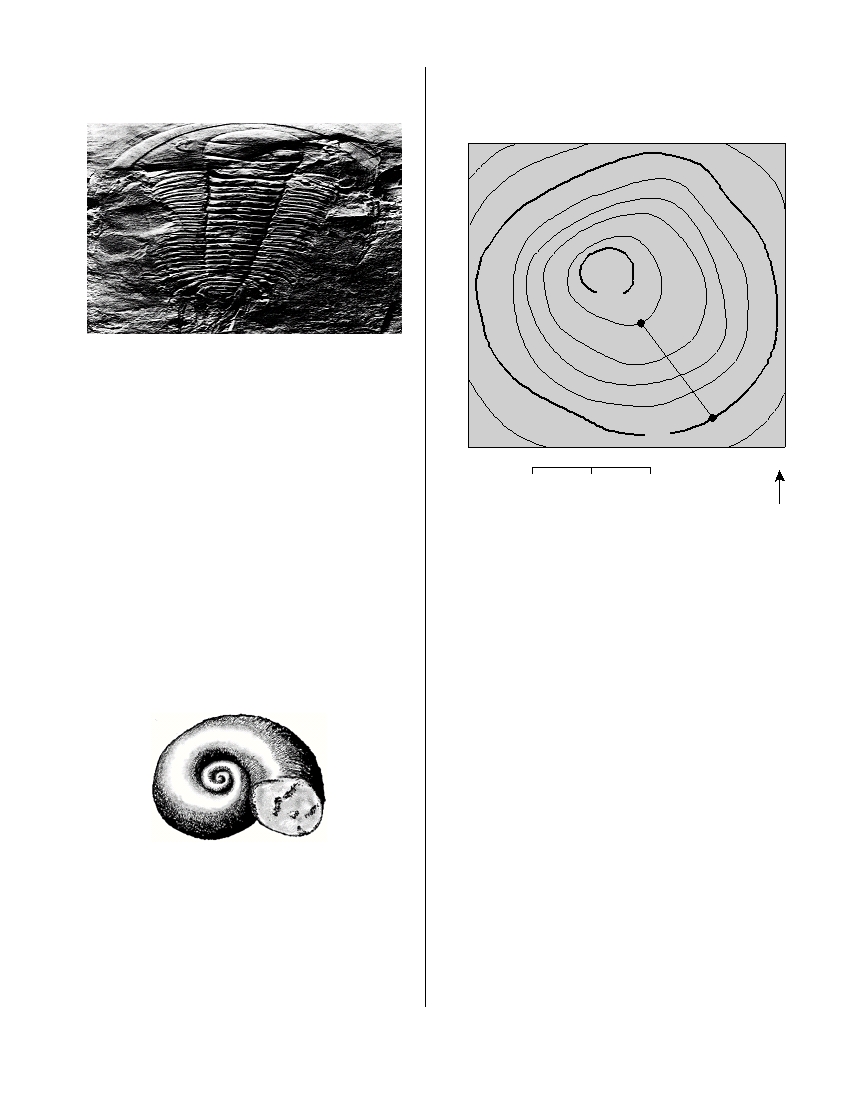
28 The fossil below was found in surface bedrock in
30 The topographic map below shows a hill. Points X
the eastern United States.
and Y represent locations on the hill’s surface.
Elevations are shown in meters.
400
X
Which statement best describes the formation of
the rock containing this fossil?
(1) The rock was formed by the metamorphism
of sedimentary rock deposited in a terrestrial
300
Y
environment during the Cretaceous Period.
(2) The rock was formed by the compaction and
N
cementation of sediments deposited in a ter-
0
1
2 km
restrial environment during the Triassic Period.
(3) The rock was formed by the compaction and
cementation of sediments deposited in a
What is the gradient between points X and Y ?
marine environment during the Cambrian
Period.
(1) 40 m/km
(3) 100 m/km
(4) The rock was formed from the solidification
(2) 80 m/km
(4) 120 m/km
of magma in a marine environment during
the Triassic Period.
29 The diagram below shows an index fossil found in
surface bedrock in some parts of New York State.
Maclurites
In which New York State landscape region is this
gastropod fossil most likely found in the surface
bedrock?
(1) Tug Hill Plateau
(2) Allegheny Plateau
(3) Adirondack Mountains
(4) Newark Lowlands
P.S./E. Sci.–June ’06
[6]
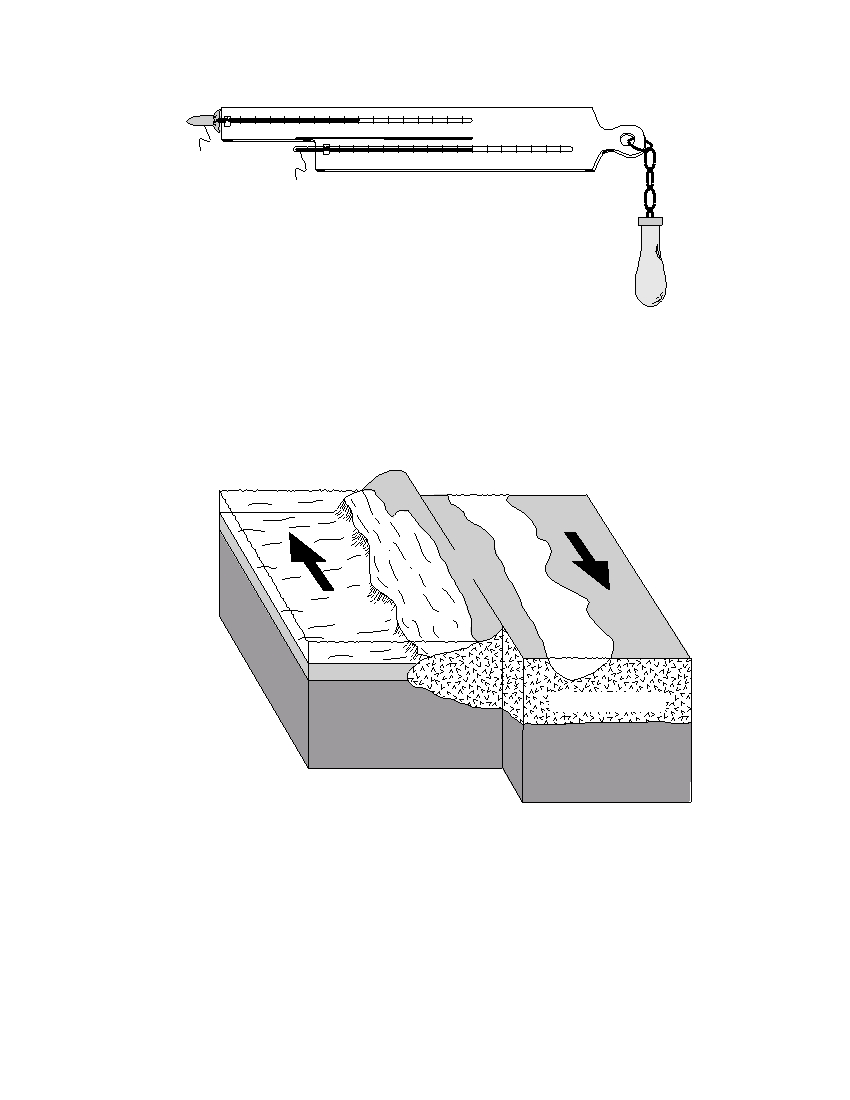
31 The diagram below shows a sling psychrometer.
– 25 – 20 – 15 – 10 – 5 0 5 10 15 20 25 30 35 40 45 50 ° C
Wet bulb
– 25 – 20 – 15 – 10 – 5 0 5 10 15 20 25 30 35 40 45 50 ° C
Dry bulb
Based on the dry-bulb temperature and the wet-bulb temperature, what is the relative
humidity?
(1) 66%
(3) 51%
(2) 58%
(4) 12%
32 Arrows in the block diagram below show the relative movement along a tectonic plate boundary.
Fault
Ocean floor
Continent
Oceanic crust
Continental crust
(Not drawn to scale)
Between which two tectonic plates does this type of plate boundary exist?
(1) Nazca Plate and South American Plate
(2) Eurasian Plate and Indian-Australian Plate
(3) North American Plate and Eurasian Plate
(4) Pacific Plate and North American Plate
P.S./E. Sci.–June ’06
[7]
[OVER]
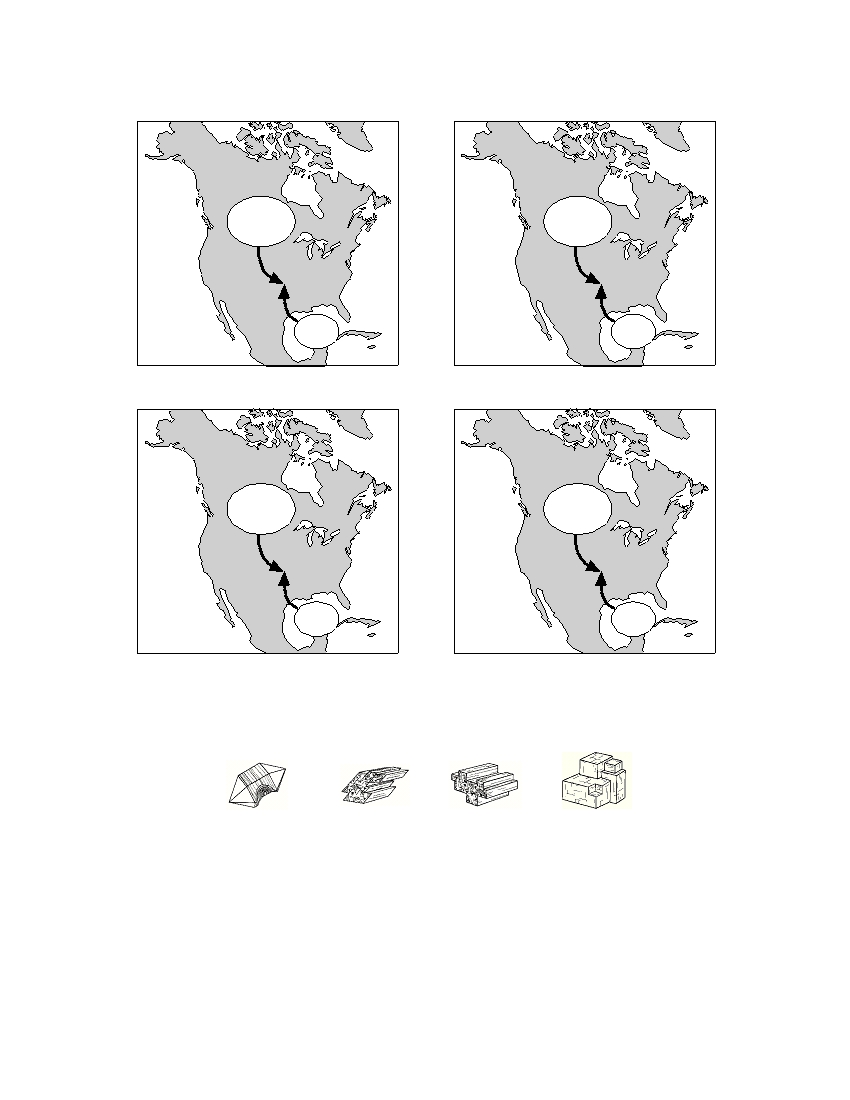
33 Which map shows the two correctly labeled air masses that frequently converge in the central plains to cause
tornadoes?
mP
mT
cT
cP
( 1 )
( 3 )
cP
cT
mT
mP
( 2 )
( 4 )
34 The diagram below shows four mineral samples, each having approximately the same mass.
Quartz
Amphibole
Pyroxene
Galena
If all four samples are placed together in a closed, dry container and shaken vigorously
for 10 minutes, which mineral sample would experience the most abrasion?
(1) quartz
(3) pyroxene
(2) amphibole
(4) galena
P.S./E. Sci.–June ’06
[8]
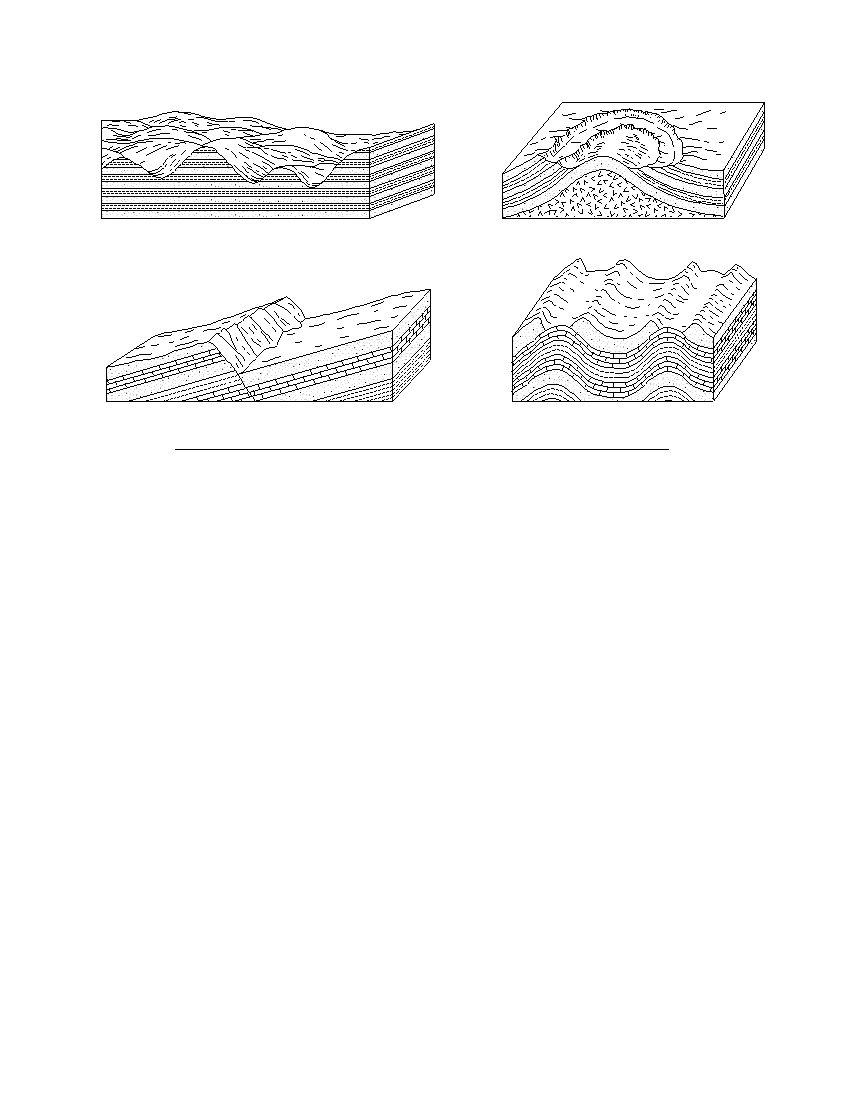
35 Which block diagram best represents a portion of a plateau?
( 1 )
( 3 )
( 2 )
( 4 )
P.S./E. Sci.–June ’06
[9]
[OVER]
Part B–1
Answer all questions in this part.
Directions (36–50): For each statement or question, write on your separate answer sheet the number of the
word or expression that, of those given, best completes the statement or answers the question. Some questions
may require the use of the Earth Science Reference Tables .
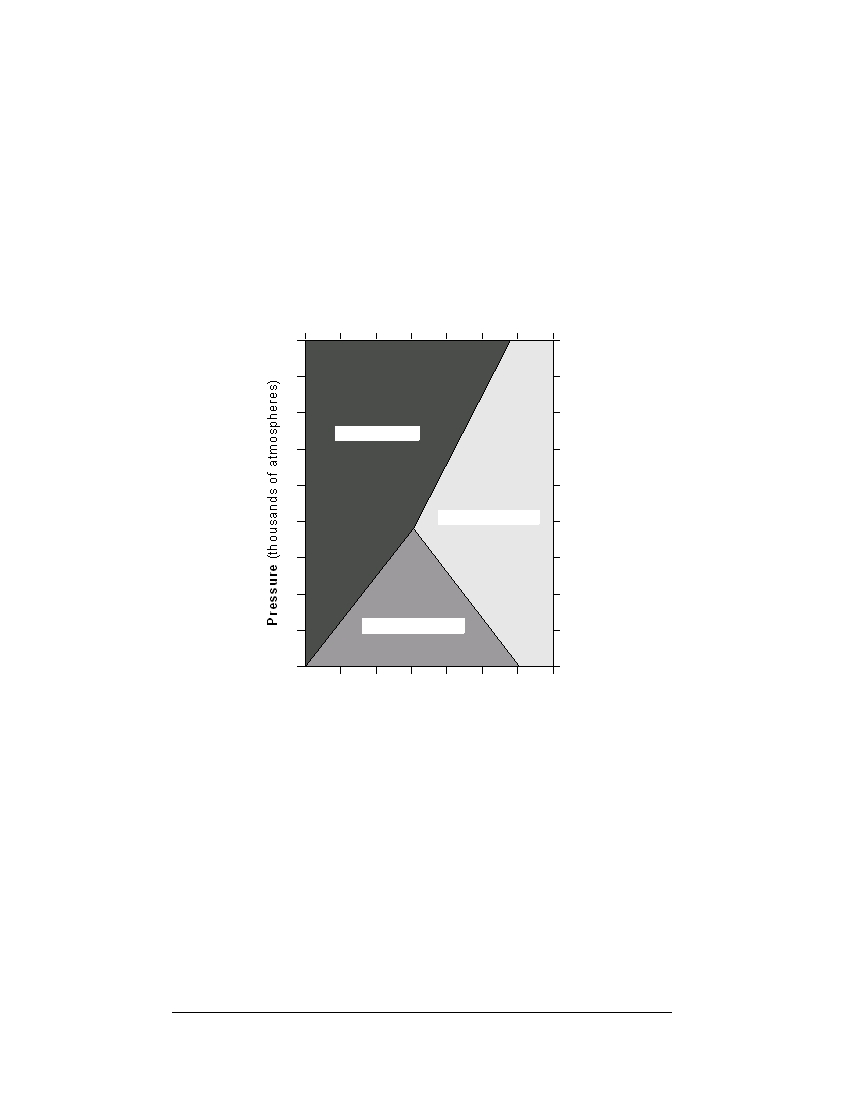
Base your answers to questions 36 through 38 on the graph below, which shows the crustal temperature and
pressure conditions under which three different minerals with the same chemical composition (Al 2 SiO 5 )
crystallize.
Conditions Under Which Three
Different Minerals Composed
of Al 2 SiO 5 Form
9
8
7
Kyanite forms
6
5
4
Sillimanite forms
3
2
1
Andalusite forms
0
300
500
700
900
Temperature ( ° C)
36 Under which crustal temperature and pressure conditions will andalusite form?
(1) 300°C and 6000 atmospheres
(3) 600°C and 4000 atmospheres
(2) 500°C and 2000 atmospheres
(4) 700°C and 8000 atmospheres
37 Which mineral has a chemical composition most similar to andalusite, sillimanite,
and kyanite?
(1) pyrite
(3) dolomite
(2) gypsum
(4) potassium feldspar
38 If bedrock at a collisional plate boundary contains andalusite crystals, these crystals
are changed into sillimanite and/or kyanite as temperature and pressure conditions
increase. What is this process called?
(1) weathering
(3) metamorphism
(2) solidification
(4) cementation
P.S./E. Sci.–June ’06
[10]
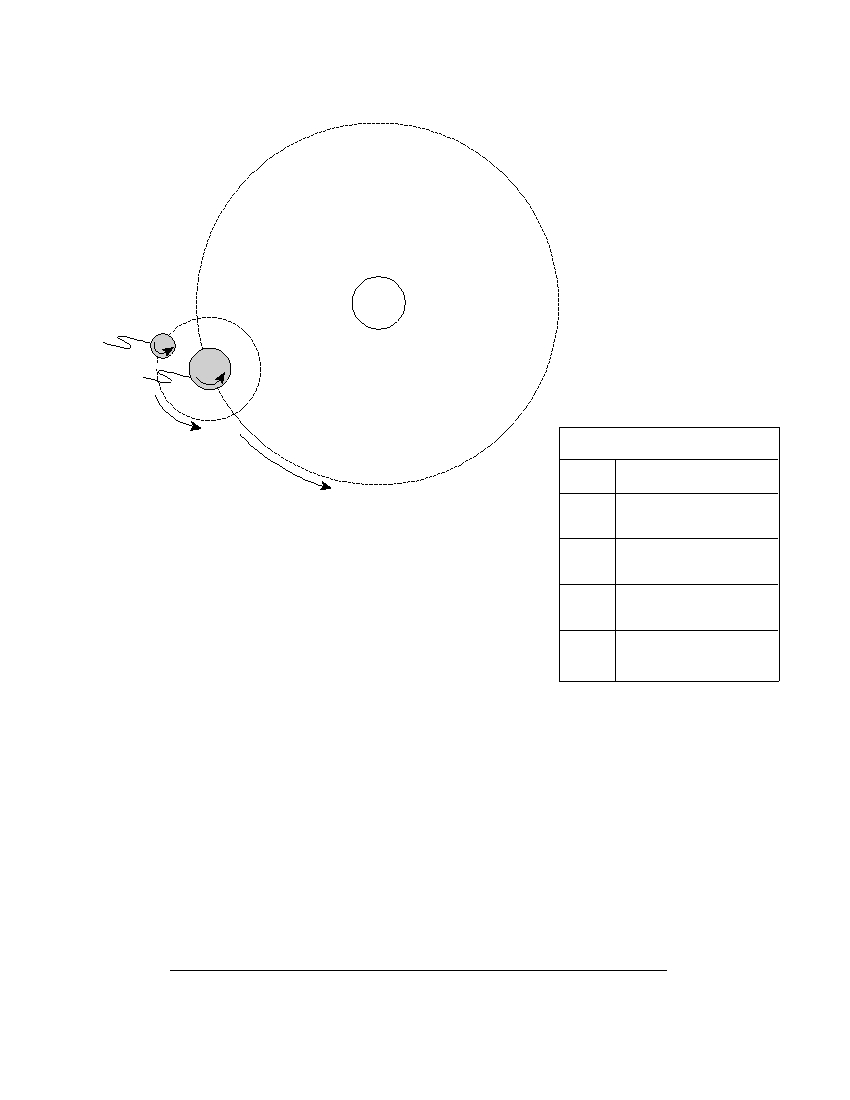
Base your answers to questions 39 through 41 on the diagram below, which has lettered arrows showing the
motions of Earth and the Moon.
Sun
Moon
C
Earth
A
D
Key
B
Arrow
Motion
Earth’s rotation
(Not drawn to scale)
A
on its axis
B
Earth’s revolution
around the Sun
C
The Moon’s rotation
on its axis
D
The Moon’s revolution
around Earth
39 These lettered arrows represent motions that are
(1) noncyclic and unpredictable
(3) cyclic and unpredictable
(2) noncyclic and predictable
(4) cyclic and predictable
40 Which two motions are completed in about the same amount of time?
(1) A and B
(3) C and D
(2) B and C
(4) A and D
41 Which lettered arrow represents the motion that causes the Moon to show phases
when viewed from Earth?
(1) A
(3) C
(2) B
(4) D
P.S./E. Sci.–June ’06
[11]
[OVER]
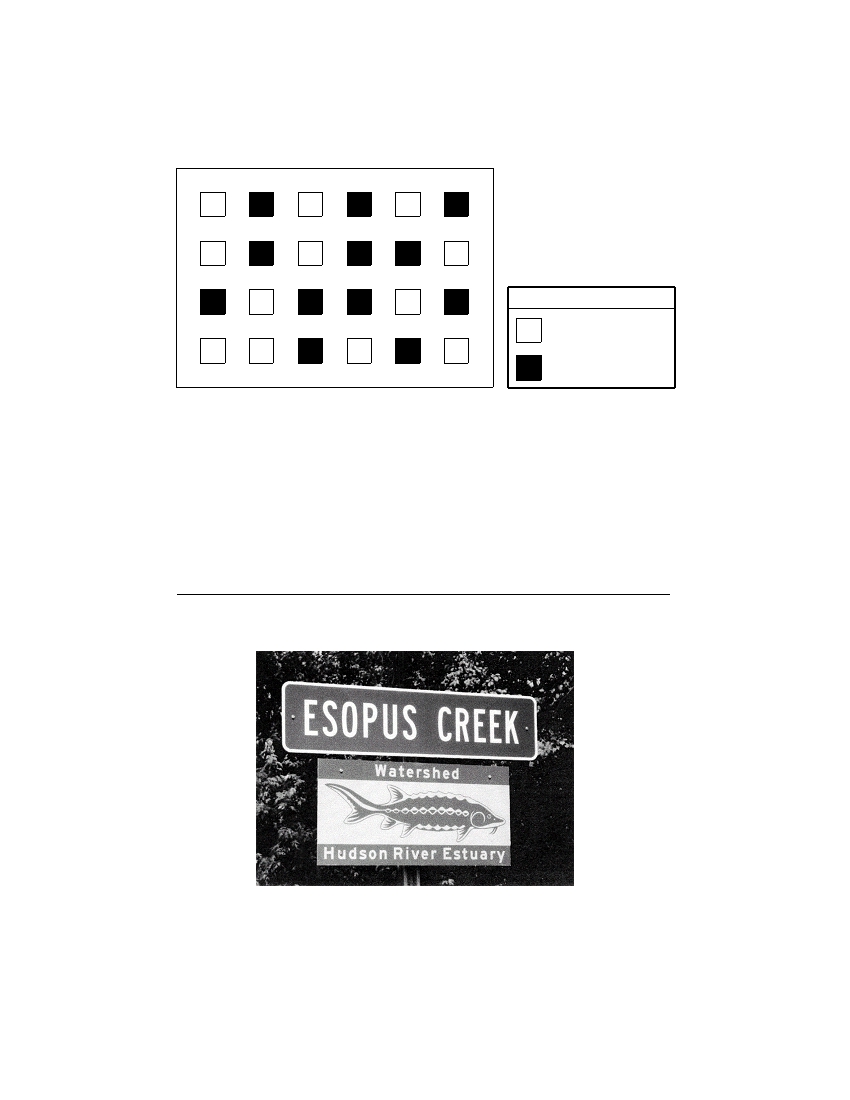
Base your answers to questions 42 and 43 on the diagram below, which represents a model of a radioactive
sample with a half-life of 5000 years. The white boxes represent undecayed radioactive material and the
shaded boxes represent the decayed material after the first half-life.
Radioactive Sample After First Half-Life
Key
Undecayed
radioactive material
Decayed material
42 How many more boxes should be shaded to represent the additional decayed
material formed during the second half-life?
(1) 12
(3) 3
(2) 6
(4) 0
43 Which radioactive isotope has a half-life closest in duration to this radioactive sample?
(1) carbon-14
(3) uranium-238
(2) potassium-40
(4) rubidium-87
44 The photograph below shows a sign near the Esopus Creek in Kingston, New York.
The main purpose of the word “watershed” on this sign is to communicate that the
Esopus Creek
(1) is a tributary of the Hudson River
(2) is a flood hazard where it flows into the Hudson River
(3) forms a delta in the Hudson River
(4) contains ancient fish fossils
P.S./E. Sci.–June ’06
[12]
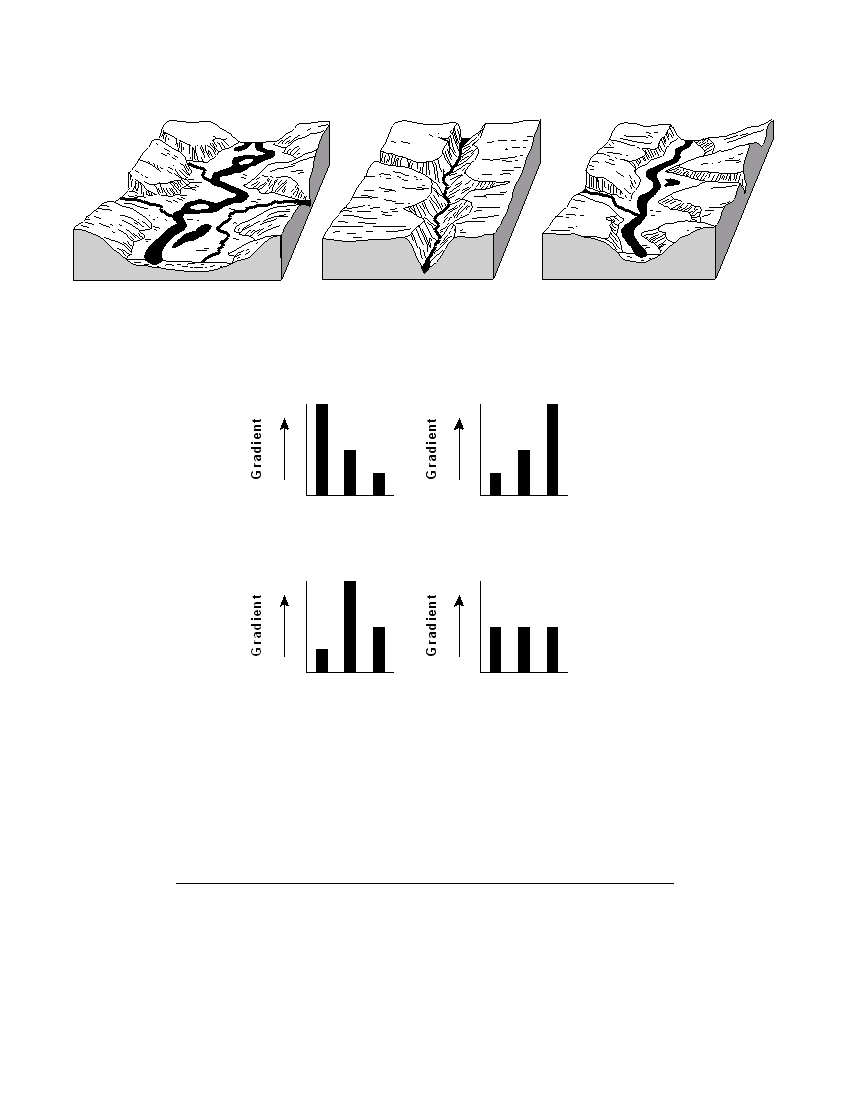
Base your answers to questions 45 and 46 on the diagrams below. Diagrams A, B, and C represent three
different river valleys.
Diagram A
Diagram B
Diagram C
45 Which bar graph best represents the relative gradients of the main rivers shown in
diagrams A, B, and C ?
Steep
Steep
Gentle
Gentle
A
B
C
A
B
C
Diagram
Diagram
( 1 )
( 3 )
Steep
Steep
Gentle
Gentle
A
B
C
A
B
C
Diagram
Diagram
( 2 )
( 4 )
46 Most sediments found on the floodplain shown in diagram A are likely to be
(1) angular and weathered from underlying bedrock
(2) angular and weathered from bedrock upstream
(3) rounded and weathered from underlying bedrock
(4) rounded and weathered from bedrock upstream
P.S./E. Sci.–June ’06
[13]
[OVER]
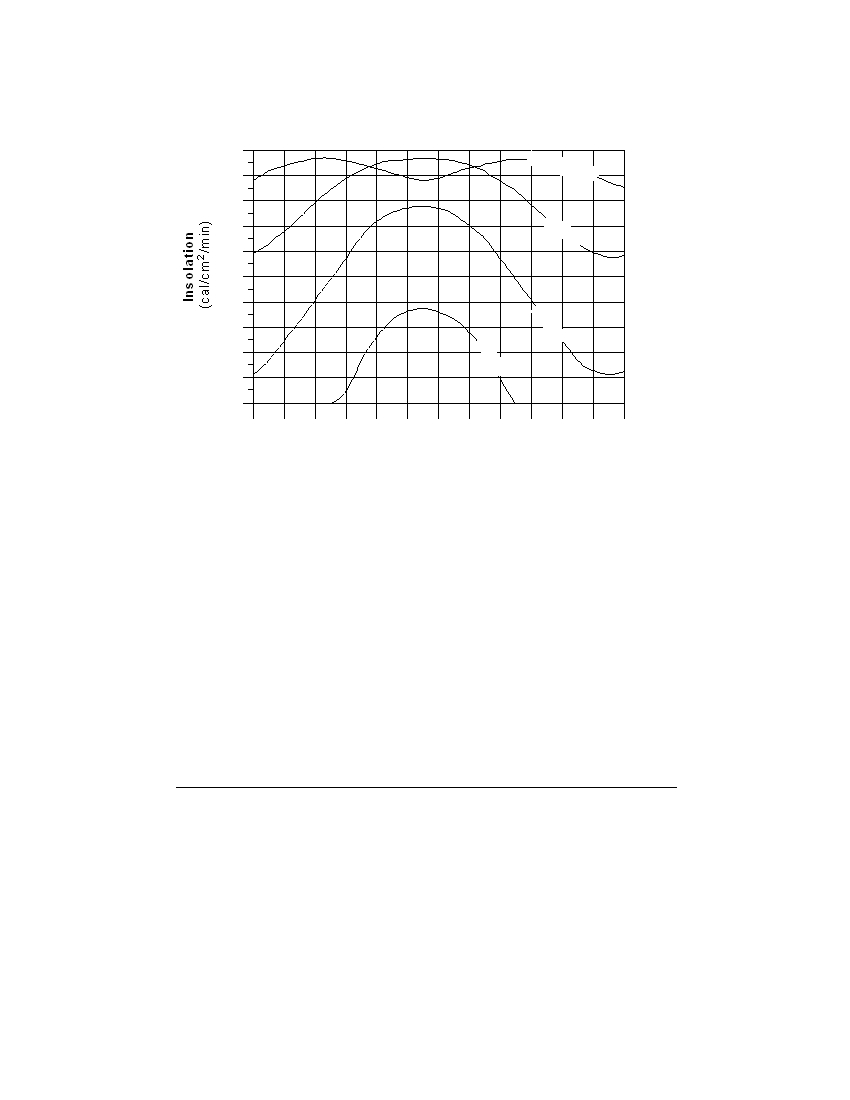
Base your answers to questions 47 through 49 on the graph below, which shows the amount of insolation
during one year at four different latitudes on Earth’s surface.
Insolation at Different Latitudes
2.0
Equator
1.8
0 °
1.6
1.4
30
°
N
1.2
1.0
0.8
60
0.6
°
N
90
0.4
°
N
0.2
0.0
Jan. Feb. Mar. Apr. May Jun. Jul. Aug. Sep. Oct. Nov. Dec.
Month
47 This graph shows that insolation varies with
(1) latitude and time of day
(3) longitude and time of day
(2) latitude and time of year
(4) longitude and time of year
48 Why is less insolation received at the equator in June than in March or September?
(1) The daylight period is longest at the equator in June.
(2) Winds blow insolation away from the equator in June.
(3) The Sun’s vertical rays are north of the equator in June.
(4) Thick clouds block the Sun’s vertical rays at the equator in June.
49 Why is insolation 0 cal/cm 2 /min from October through February at 90° N?
(1) Snowfields reflect sunlight during that time.
(2) Dust in the atmosphere blocks sunlight during that time.
(3) The Sun is continually below the horizon during that time.
(4) Intense cold prevents insolation from being absorbed during that time.
P.S./E. Sci.–June ’06
[14]
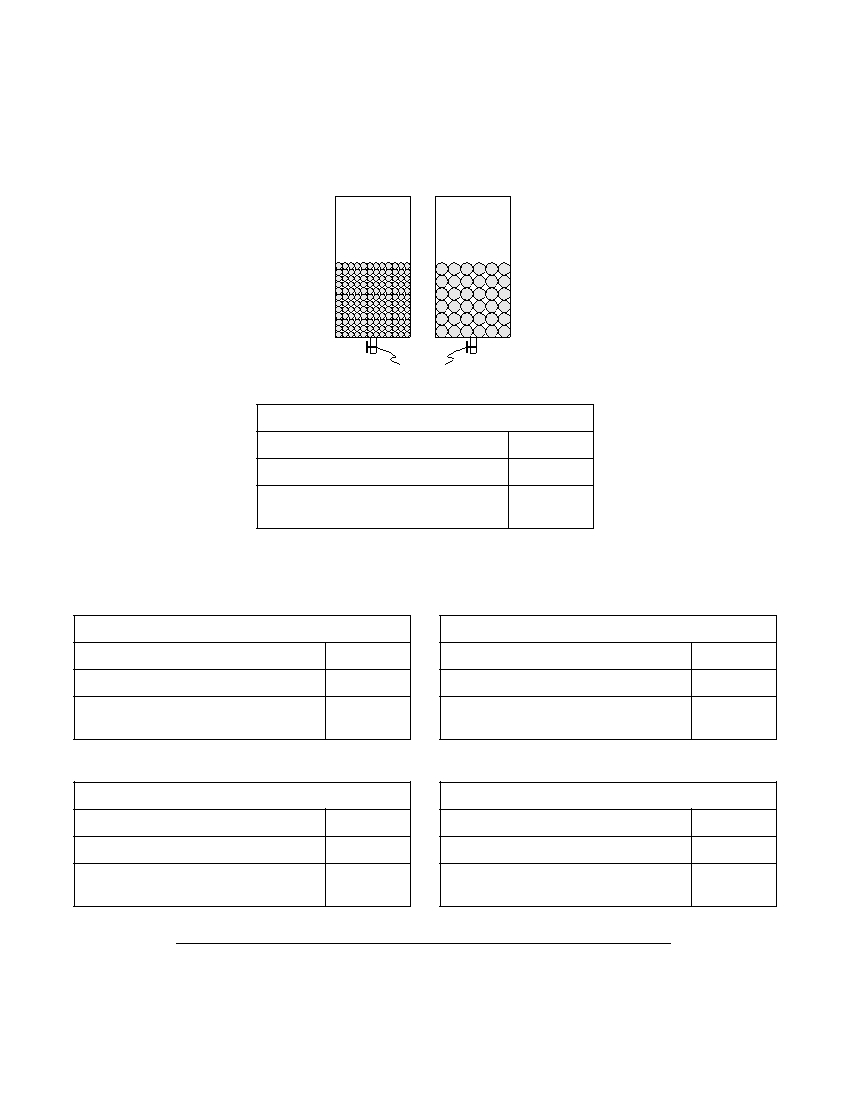
50 The diagram below shows tubes A and B partly filled with equal volumes of round
plastic beads of uniform size. The beads in tube A are smaller than the beads in
tube B . Water was placed in tube A until the pore spaces were filled. The drain valve
was then opened, and the amount of time for the water to drain from the tube was
recorded. The amount of water that remained around the beads was then
calculated and recorded. Data table 1 shows the measurements recorded using tube A .
Tube A
Tube B
Drain
valves
Data Table 1:Tube A
water required to fill pore spaces
124 mL
time required for draining
2.1 sec
water that remained around the beads
after draining
36 mL
If the same procedure was followed with tube B , which data table shows the
measurements most likely recorded?
Data Table 2:Tube B
Data Table 2:Tube B
water required to fill pore spaces
124 mL
water required to fill pore spaces
124 mL
time required for draining
1.4 sec
time required for draining
3.2 sec
water that remained around the beads
water that remained around the beads
after draining
26 mL
after draining
36 mL
(1)
(3)
Data Table 2:Tube B
Data Table 2:Tube B
water required to fill pore spaces
168 mL
water required to fill pore spaces
168 mL
time required for draining
3.2 sec
time required for draining
1.4 sec
water that remained around the beads
water that remained around the beads
after draining
46 mL
after draining
36 mL
(2)
(4)
P.S./E. Sci.–June ’06
[15]
[OVER]
Part B–2
Answer all questions in this part.
Directions (51–64): Record your answers in the spaces provided in your answer booklet. Some questions
may require the use of the Earth Science Reference Tables.
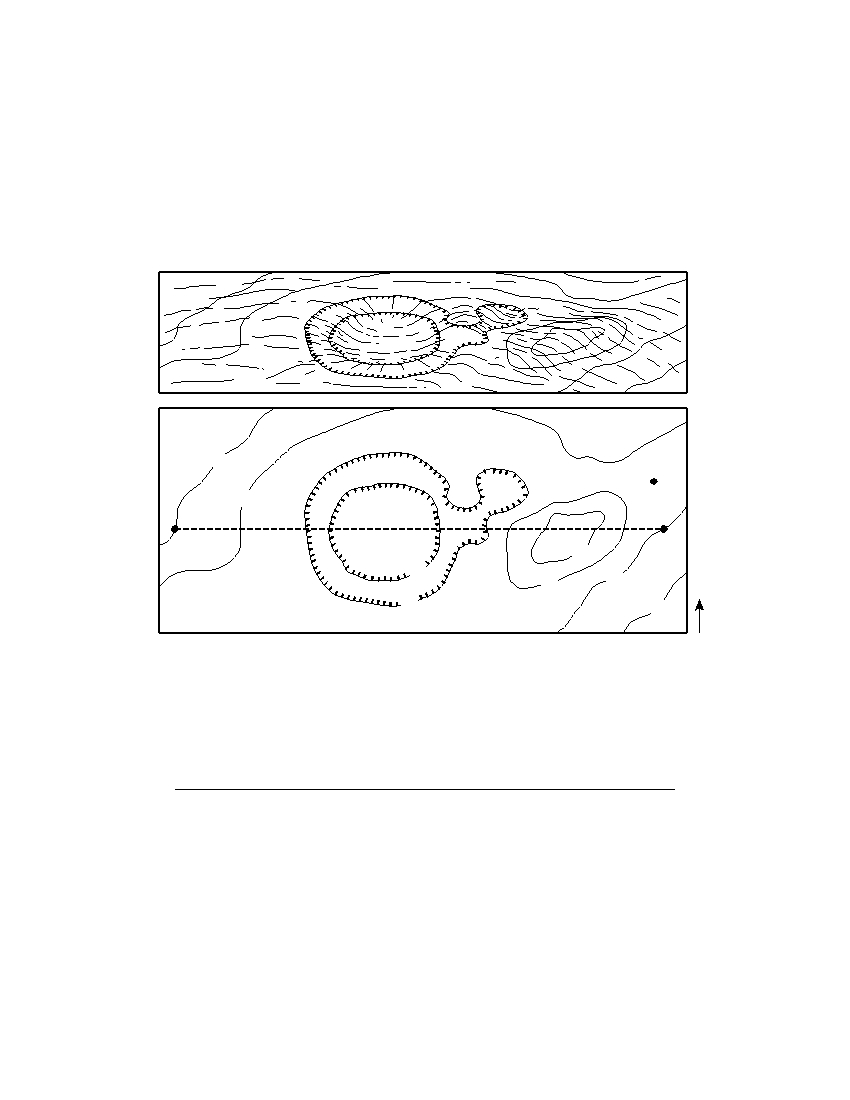
Base your answers to questions 51 and 52 on the diagrams below. The top diagram shows a depression and
hill on a gently sloping area. The bottom diagram is a topographic map of the same area. Points A, X, and Y are
locations on Earth’s surface. A dashed line connects points X and Y . Elevation is indicated in feet.
10
A
20
X
Y
40
10
30
20
N
20
10
51 What is a possible elevation of point A ? [ 1 ]
52 On the grid in your answer booklet, construct a topographic profile along line XY,
by plotting a point for the elevation of each contour line that crosses line XY . Points
X and Y have already been plotted on the grid. Connect the points with a smooth,
curved line to complete the profile. [ 2 ]
P.S./E. Sci.–June ’06
[16]
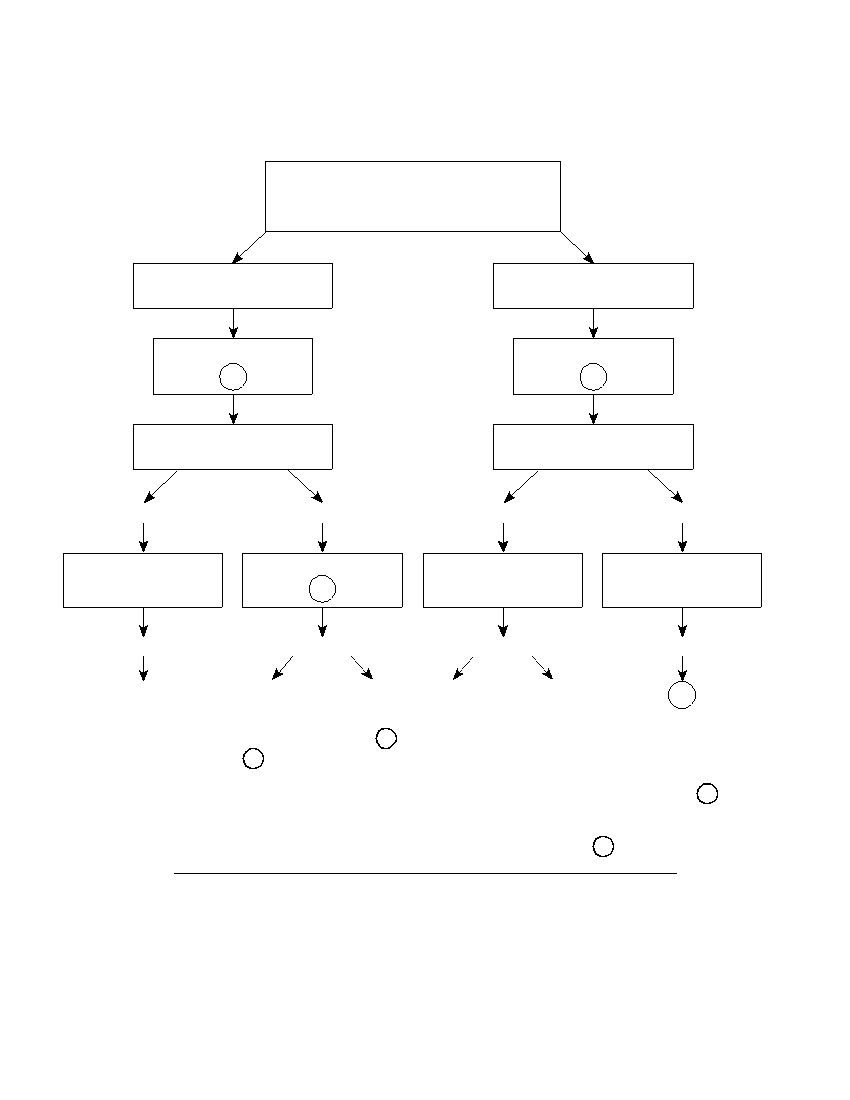
Base your answers to questions 53 through 55 on the flowchart below and on your knowledge of Earth
science. The flowchart shows the formation of some igneous rocks. The circled letters A, B, C, and D indicate
parts of the flowchart that have not been labeled.
Some Igneous Rocks
Molten (melted) rock
Magma
Lava
below Earth’s surface
on or near Earth’s surface
Cooling rate
Cooling rate
A
B
Intrusive igneous rock
Extrusive igneous rock
Very coarse texture
Coarse texture
Fine-grained texture
Glassy texture
Grain size
Grain size
Grain size
Grain size
10 mm or larger
C
Less than 1 mm
Noncrystalline
Example
Examples
Examples
Example
Pegmatite
Granite
Gabbro
Rhyolite
Basalt
D
53 Contrast the rate of cooling at A that forms intrusive igneous rock with the rate of
cooling at B that forms extrusive igneous rock. [ 1 ]
54 Give the numerical grain-size range that should be placed in the flowchart at C .
Units must be included in your answer. [ 1 ]
55 State one igneous rock that could be placed in the flowchart at D . [ 1 ]
P.S./E. Sci.–June ’06
[17]
[OVER]

Base your answers to questions 56 through 60 on the two diagrams in your answer booklet. Diagram I shows
the orbits of the four inner planets. Black dots in diagram I show the positions in the orbits where each planet
is closest to the Sun. Diagram II shows the orbits of the six planets that are farthest from the Sun. The distance
scale in diagram II is different than the distance scale in diagram I.
56 On diagram I in your answer booklet, place the letter W on Mars’ orbit to represent
the position of Mars where the Sun’s gravitational force on Mars would be weakest . [ 1 ]
57 On diagram II in your answer booklet, circle the names of the two largest Jovian
planets. [ 1 ]
58 How long does it take the planet Uranus to complete one orbit around the Sun?
Units must be included in your answer. [ 1 ]
59 Describe how the orbits of each of the nine planets are similar in shape. [ 1 ]
60 Pluto’s orbital speed is usually slower than Neptune’s orbital speed. Based on
diagram II, explain why Pluto’s orbital speed is sometimes faster than Neptune’s
orbital speed. [ 1 ]
P.S./E. Sci.–June ’06
[18]
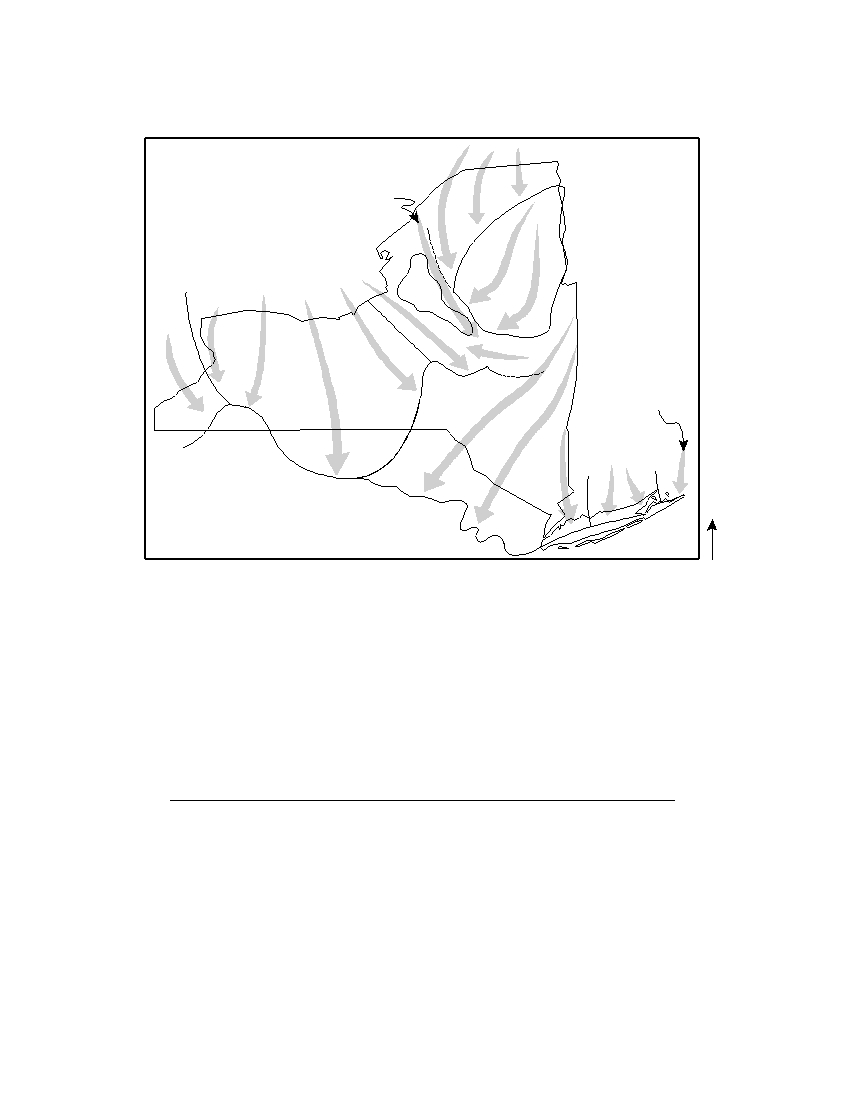
Base your answers to questions 61 through 64 on the map below, which shows the different lobes (sections)
of the Laurentide Ice Sheet, the last continental ice sheet that covered most of New York State. The arrows show
the direction that the ice lobes flowed. The terminal moraine shows the maximum advance of this ice sheet.
St. Lawrence Lobe
Black River
Lobe
Adirondack
g
u
T
Lobe
O n t a ri o L o b e
H
i ll
U
p
l a
Oneida dn
Lobe
Erie
M o h a w k
Lobe
L o b e
L
o
b
e
i n
Narragansett
p
la
Lobe
h
a
m
Connecticut
o
n
- C
Lobe
T e
r m
H
u
ds
i n
a l M o r a i n
e
N
61 During which geologic epoch did the Laurentide Ice Sheet advance over New York
State? [ 1 ]
62 Describe the arrangement of rock material in the sediments that were directly
deposited by the glacier. [ 1 ]
63 According to the map, toward which compass direction did the ice lobe flow over the
Catskills? [ 1 ]
64 What evidence might be found on surface bedrock of the Catskills that would
indicate the direction of ice flow in this region? [ 1 ]
P.S./E. Sci.–June ’06
[19]
[OVER]

Part C
Answer all questions in this part.
Directions (65–83): Record your answers in the spaces provided in your answer booklet. Some questions
may require the use of the Earth Science Reference Tables.
Base your answers to questions 65 and 66 on the diagram below, which represents water molecules attached
to salt and dust particles within a cloud in the atmosphere.
(Not drawn to scale)
Key
Water
molecule
Salt
Dust
65 Explain why salt and dust particles are important in cloud formation. [ 1 ]
66 State one natural process that causes large amounts of dust to enter Earth’s
atmosphere. [ 1 ]
P.S./E. Sci.–June ’06
[20]
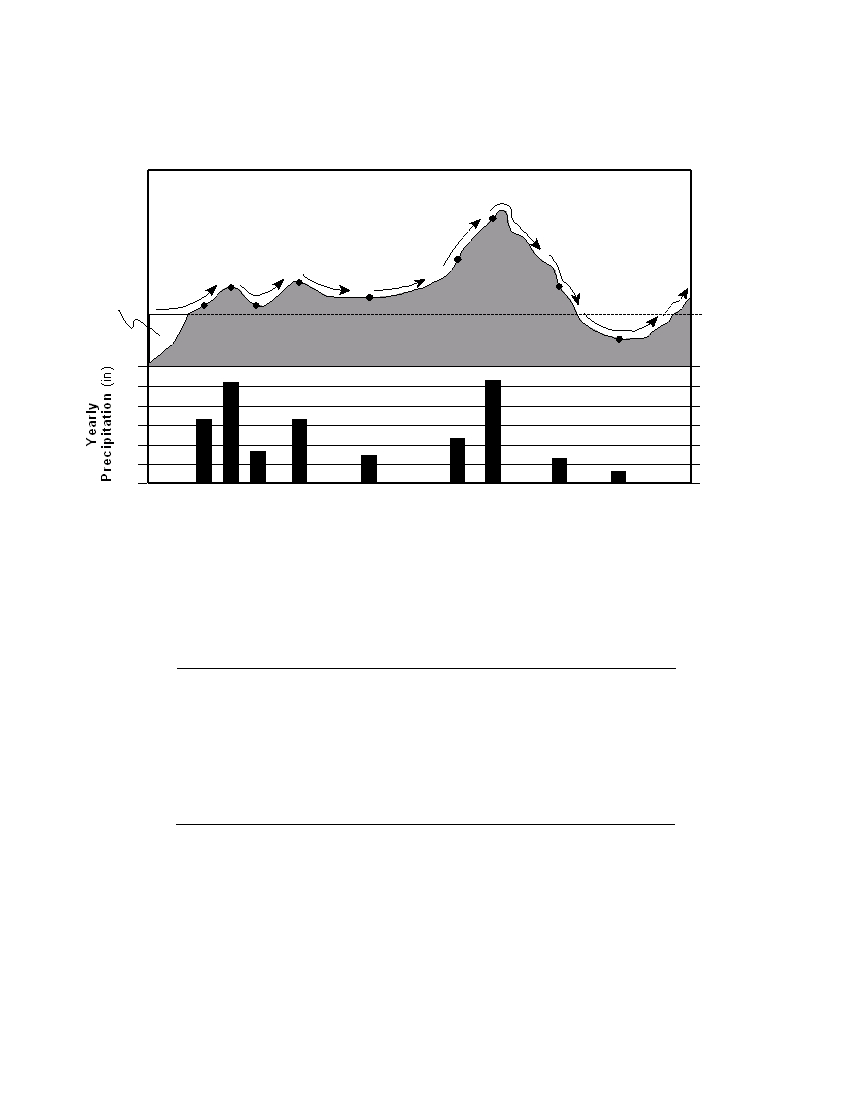
Base your answers to questions 67 through 69 on the cross section and bar graph below. The cross section
shows a portion of Earth’s crust along the western coast of the United States. The points show different
locations on Earth’s surface. The arrows show the prevailing wind direction. The bar below each point shows
the yearly precipitation at that location.
West
Sierra Nevada
East
Mountain Range
Coastal Mountain
Ranges
San Joaquin
Valley
Pacific
Death
Ocean
Valley
Sea Level
60
60
40
40
20
20
0
0
67 Explain why the valleys have lower amounts of precipitation than points on the
western slopes of the mountain ranges. [ 1 ]
68 What is the yearly precipitation total for the four points located in the Coastal
Mountain Ranges? [ 1 ]
69 State one reason why colder temperatures would be recorded at the top of the Sierra
Nevada Mountain Range than at the top of the Coastal Mountain Ranges. [ 1 ]
Base your answers to questions 70 and 71 on the diagram in your answer booklet , which shows the latitude-
longitude grid on a model of Earth. Point Y is a location on Earth’s surface.
70 On the diagram in your answer booklet, place an X at 15° S 30° W. [ 1 ]
71 What is Earth’s rate of rotation at point Y , in degrees per hour? [ 1 ]
P.S./E. Sci.–June ’06
[21]
[OVER]

Base your answers to questions 72 through 76 on the two maps in your answer booklet and on your
knowledge of Earth science. Both maps show data from a December snowstorm. Map 1 shows the snowfall,
measured in inches, at various locations in New York State, Pennsylvania, and New Jersey. Map 2 shows
weather conditions in New York State and the surrounding region during the storm. Letter L represents the
center of the low-pressure system that produced the snowstorm. Isobars show air pressure, in millibars.
72 On map 1 in your answer booklet, draw the 30.0-inch snowfall isoline. Assume that
the decimal point for each snowfall depth marks the exact location where the snow-
fall was measured. [ 1 ]
73 Most residents knew this storm was coming. State one action a New York State
resident should have taken to prepare for a snow emergency. [ 1 ]
74 Using map 2, complete the table in your answer booklet by describing the weather
conditions at Buffalo, New York. [ 2 ]
75 Describe the general surface wind pattern around the low-pressure center shown on
map 2. [ 1 ]
76 Toward which compass direction would this low-pressure center most likely have
moved if this system followed a normal storm track? [ 1 ]
P.S./E. Sci.–June ’06
[22]
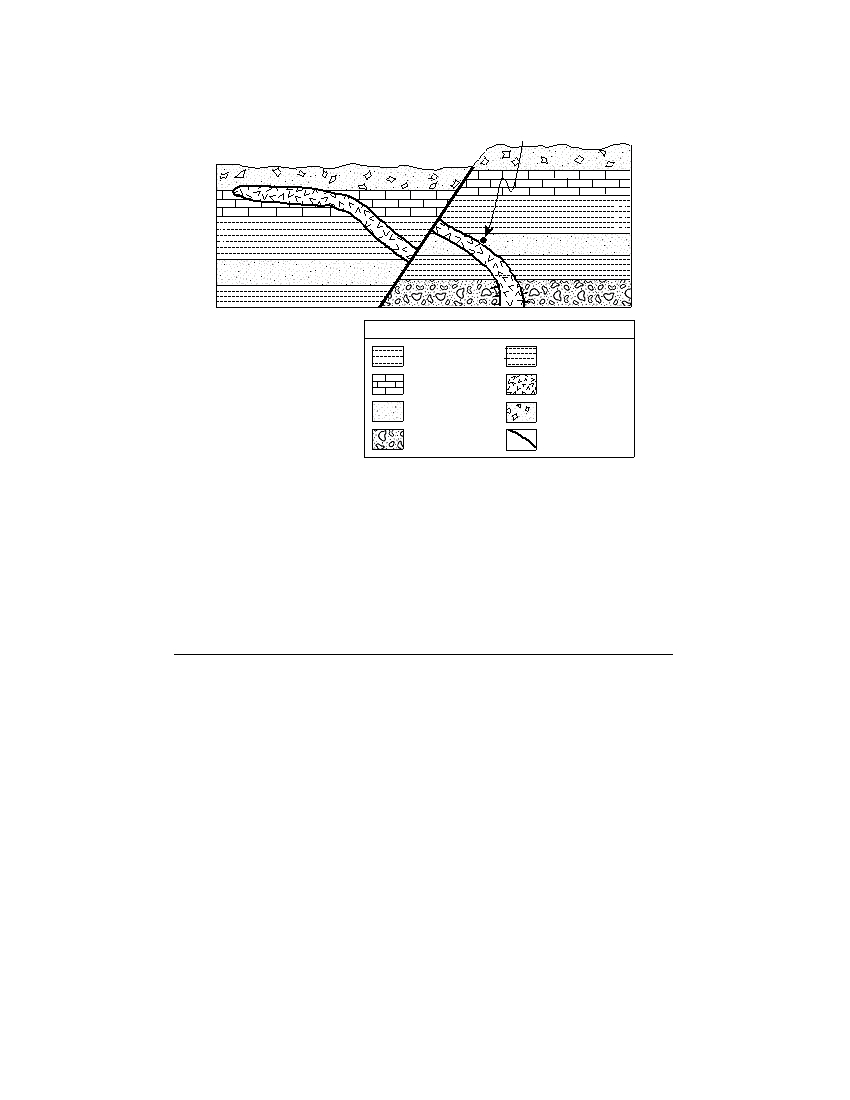
Base your answers to questions 77 through 80 on the geologic cross section below. The rock layers have not
been overturned. Point A is located in the zone of contact metamorphism.
A
I I I I I I I I I I I
I I I
I
I I I I I I I I I I I
I I I
I
I
I
I
I
I I I
I
I
I I
I
I
I
I
I
I
I
I
I
I
I
I
I
I
I
I
I
I
I
I
I
I
I
I
I
I
I
I
I
I
I
I
Key
Siltstone
Shale
Limestone
Basalt
intrusion
Sandstone
Breccia
I
I
I
I
Conglomerate
I I Contact
I metamorphism
77 Which metamorphic rock most likely formed at point A ? [ 1 ]
78 State the evidence shown by the cross section that supports the inference that the
fault is younger than the basalt intrusion. [ 1 ]
79 In your answer booklet, list basalt, limestone, and breccia in the order in which they
were formed. [ 1 ]
80 What is the largest silt particle that could be found in the siltstone layer? [ 1 ]
P.S./E. Sci.–June ’06
[23]
[OVER]

Base your answers to questions 81 through 83 on the passage below and on your knowledge of Earth science.
A New Oregon Volcano?
The Three Sisters are 10,000-foot volcanic mountain peaks in Oregon. Volcanic
eruptions began building the Three Sisters from andesitic lava and cinders 700,000 years
ago. The last major eruption occurred 2000 years ago.
West of the Three Sisters peaks, geologists have recently discovered that Earth’s surface
is bulging upward in a bull’s-eye pattern 10 miles wide. There is a 4-inch rise at its center,
which geologists believe could be the beginning of another volcano. The uplift was found
by comparing satellite images. This uplift in Oregon may allow the tracking of a volcanic
eruption from its beginning, long before the smoke and explosions begin.
This uplift is most likely caused by an upflow of molten rock from more than four miles
below the surface. Rock melts within Earth’s interior and then moves upward in cracks in
Earth’s crust, where it forms large underground pools called magma chambers. Magma
upwelling often produces signs that help scientists predict eruptions and protect humans.
When the pressure of rising magma becomes forceful enough to crack bedrock, swarms of
small earthquakes occur. Rising magma releases carbon dioxide and other gases that can be
detected at the surface.
81 Identify one of the minerals found in the andesite rock of the Three Sisters
volcanoes. [ 1 ]
82 The cross section in your answer booklet represents Earth’s interior beneath the
Three Sisters. Place a triangle, L , on the cross section to indicate the location where
the new volcano will most likely form. [ 1 ]
83 On the same cross section, place arrows through each point, X, Y, and Z, to indicate
the relative motion of each of these sections of the lithosphere. [ 1 ]
P.S./E. Sci.–June ’06
[24]


The University of the State of New York
R EGENTS H IGH S CHOOL E XAMINATION
PHYSICAL SETTING
EARTH SCIENCE
Tuesday, June 20, 2006 — 9:15 a.m. to 12:15 p.m., only
ANSWER SHEET
Student . . . . . . . . . . . . . . . . . . . . . . . . . . . . . . . . . . . . . . . . . . . . . . .
Sex:
I Male I Female
Grade . . . . . . . . . . . .
Teacher . . . . . . . . . . . . . . . . . . . . . . . . . . . . . . . . . . . . . . . . . . . . . . .
School . . . . . . . . . . . . . . . . . . . . . . . . . . . . . . . . . . . .
Record your answers to Part A and Part B–1 on this answer sheet.
Part A
Part B–1
1 . . . . . . . . . . . .
13 . . . . . . . . . . . .
25 . . . . . . . . . . .
36 . . . . . . . . . . . .
44 . . . . . . . . . . . .
2 . . . . . . . . . . . .
14 . . . . . . . . . . . .
26 . . . . . . . . . . .
37 . . . . . . . . . . . .
45 . . . . . . . . . . . .
3 . . . . . . . . . . . .
15 . . . . . . . . . . . .
27 . . . . . . . . . . .
38 . . . . . . . . . . . .
46 . . . . . . . . . . . .
4 . . . . . . . . . . . .
16 . . . . . . . . . . . .
28 . . . . . . . . . . .
39 . . . . . . . . . . . .
47 . . . . . . . . . . . .
5 . . . . . . . . . . . .
17 . . . . . . . . . . . .
29 . . . . . . . . . . .
40 . . . . . . . . . . . .
48 . . . . . . . . . . . .
6 . . . . . . . . . . . .
18 . . . . . . . . . . . .
30 . . . . . . . . . . .
41 . . . . . . . . . . . .
49 . . . . . . . . . . . .
7 . . . . . . . . . . . .
19 . . . . . . . . . . . .
31 . . . . . . . . . . .
42 . . . . . . . . . . . .
50 . . . . . . . . . . . .
Part B–1 Score
8 . . . . . . . . . . . .
20 . . . . . . . . . . . .
32 . . . . . . . . . . .
43 . . . . . . . . . . . .
9 . . . . . . . . . . . .
21 . . . . . . . . . . . .
33 . . . . . . . . . . .
10 . . . . . . . . . . . .
22 . . . . . . . . . . . .
34 . . . . . . . . . . .
11 . . . . . . . . . . . .
23 . . . . . . . . . . . .
35 . . . . . . . . . . .
Part A Score
12 . . . . . . . . . . . .
24 . . . . . . . . . . . .
Write your answers to Part B–2 and Part C in your answer booklet.
The declaration below should be signed when you have completed the examination.
I do hereby affirm, at the close of this examination, that I had no unlawful knowledge of the questions or answers prior to
the examination and that I have neither given nor received assistance in answering any of the questions during the examination.
Signature

PS/EARTH SCIENCE
E C N E I C S H T R A E / S P