
PS/EARTH SCIENCE
The University of the State of New York
REGENTS HIGH SCHOOL EXAMINATION
PHYSICAL SETTING
EARTH SCIENCE
Tuesday, June 19, 2007 — 9:15 a.m. to 12:15 p.m., only
This is a test of your knowledge of Earth science. Use that knowledge to answer
all questions in this examination. Some questions may require the use of the Earth
Science Reference Tables. The Earth Science Reference Tables are supplied separately.
Be certain you have a copy of the 2001 Edition (Revised November 2006) of these
reference tables before you begin the examination.
Your answer sheet for Part A and Part B–1 is the last page of this examination
booklet. Turn to the last page and fold it along the perforations. Then, slowly and
carefully, tear off your answer sheet and fill in the heading.
The answers to the questions in Part B–2 and Part C are to be written in your
separate answer booklet. Be sure to fill in the heading on the front of your answer
booklet.
You are to answer all questions in all parts of this examination according to the
directions provided in the examination booklet. Record your answers to the Part A
and Part B–1 multiple-choice questions on your separate answer sheet. Write your
answers to the Part B–2 and Part C questions in your answer booklet. All work should
be written in pen, except for graphs and drawings, which should be done in pencil.
You may use scrap paper to work out the answers to the questions, but be sure to
record all your answers on your separate answer sheet and in your answer booklet.
When you have completed the examination, you must sign the statement printed
at the end of your separate answer sheet, indicating that you had no unlawful
knowledge of the questions or answers prior to the examination and that you have
neither given nor received assistance in answering any of the questions during the
examination. Your answer sheet and answer booklet cannot be accepted if you fail to
sign this declaration.
Notice. . .
A four-function or scientific calculator and a copy of the 2001 Earth Science Reference Tables
(Revised November 2006) must be available for you to use while taking this examination.
The use of any communications device is strictly prohibited when taking this
examination. If you use any communications device, no matter how briefly, your
examination will be invalidated and no score will be calculated for you.
DO NOT OPEN THIS EXAMINATION BOOKLET UNTIL THE SIGNAL IS GIVEN.
E C N E I C S H T R A E / S P
Part A
Answer all questions in this part.
Directions (1–35): For each statement or question, write on your separate answer sheet the number of the
word or expression that, of those given, best completes the statement or answers the question. Some questions
may require the use of the Earth Science Reference Tables .
1 The best evidence that Earth spins on its axis is
4 The average temperature at Earth’s equator is
the motion of
higher than the average temperature at Earth’s
(1) tectonic plates
South Pole because the South Pole
(2) Polaris
(1) receives less intense insolation
(3) a wind vane
(2) receives more infrared radiation
(4) a Foucault pendulum
(3) has less land area
(4) has more cloud cover
2 When viewed from Earth, the light from very
distant galaxies shows a red shift. This is evidence
5 Which statement best summarizes the general
that these distant galaxies are
effects of ocean currents at 20° S latitude on coastal
(1) revolving around the Sun
regions of South America?
(2) revolving around the Milky Way
(1) The east coast and west coast are both warmed.
(3) moving away from Earth
(2) The east coast and west coast are both cooled.
(4) moving toward Earth
(3) The east coast is warmed and the west coast
is cooled.
(4) The east coast is cooled and the west coast is
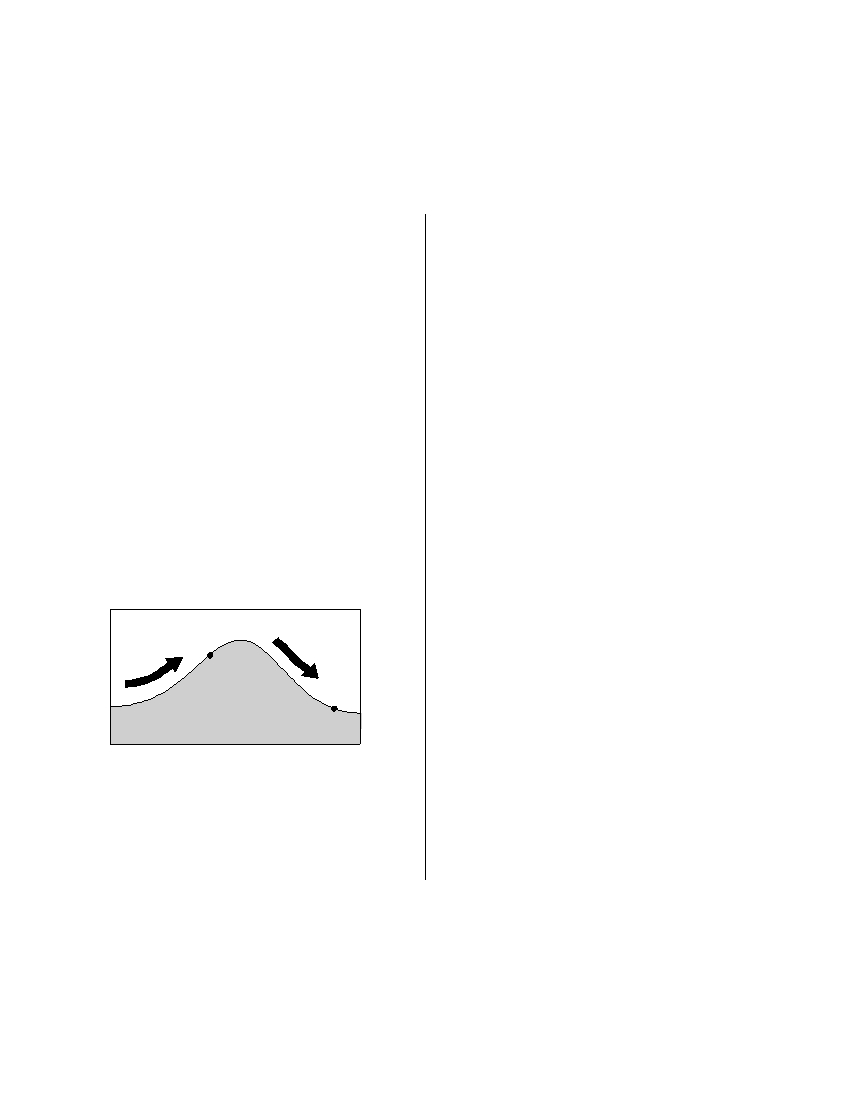
3 The arrows on the cross section below show the
warmed.
prevailing wind that flows over a mountain.
Points A and B represent locations on opposite
sides of the mountain.
6 Which type of electromagnetic energy has the
longest wavelength?
(1) infrared radiation
(2) radio wave radiation
A
(3) ultraviolet radiation
(4) x-ray radiation
B
7 Under which atmospheric conditions will water
most likely evaporate at the fastest rate?
(1) hot, humid, and calm
Which statement correctly describes the differ-
(2) hot, dry, and windy
ences in the climates of locations A and B ?
(3) cold, humid, and windy
(1) Location A is warmer and drier than location B .
(4) cold, dry, and calm
(2) Location A is cooler and wetter than location B .
(3) Location B is warmer and wetter than location A .
(4) Location B is cooler and drier than location A .
P.S./E. Sci.–June ’07
[2]
8 Which temperature zone of Earth’s atmosphere
12 The two elements that make up the largest per-
contains the most water vapor?
centage by mass of Earth’s crust are oxygen and
(1) mesosphere
(3) thermosphere
(1) silicon
(3) hydrogen
(2) stratosphere
(4) troposphere
(2) potassium
(4) nitrogen
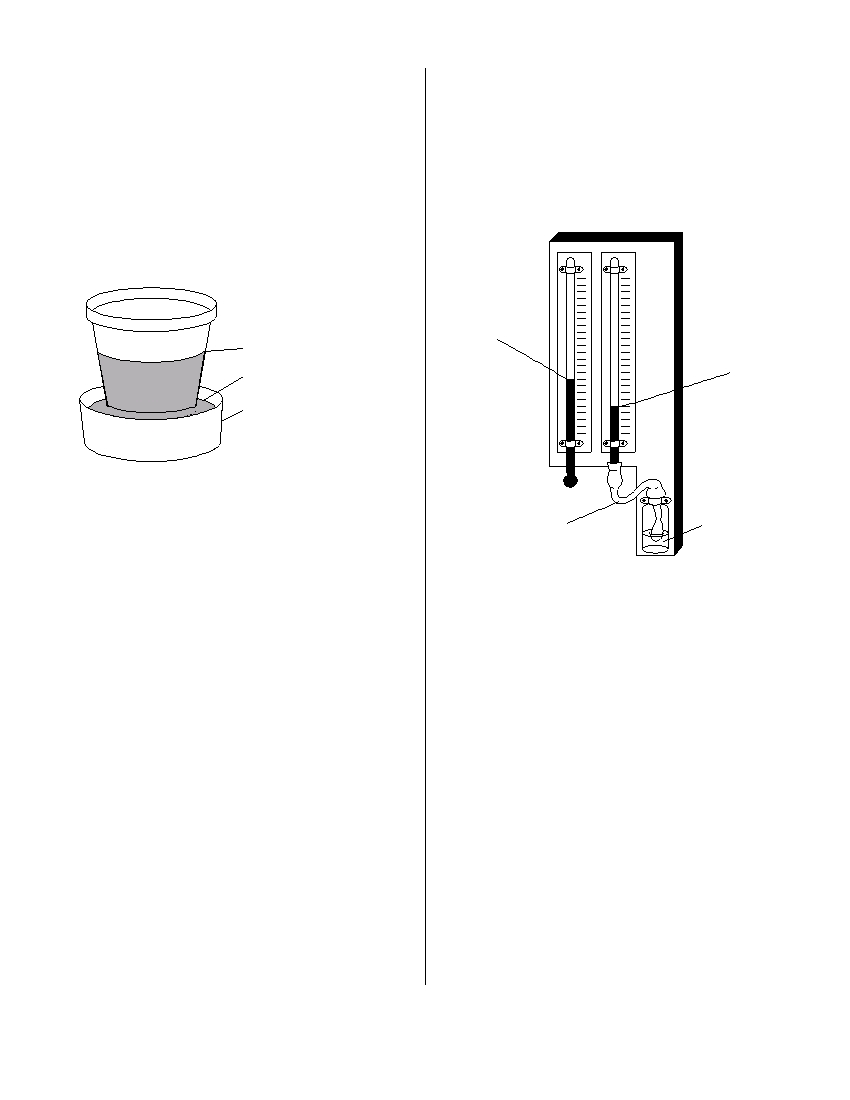
9 The diagram below shows the result of leaving an
13 The weather instrument below can be used to
empty, dry clay flowerpot in a full container of
determine relative humidity.
water for a period of time. The water level in the
container dropped to level A . The top of the wet
area moved to level B .
18 ° C
B (wet to this height)
A (water level)
10 ° C
Container
Level B is higher than level A because water
(1) is less dense than the clay pot
Reservoir
Wet cloth wick
of water
(2) is more dense than the clay pot
(3) traveled upward in the clay pot by capillary
action
(4) traveled downward in the clay pot by capillary
Based on the temperatures shown, the relative
action
humidity is
(1) 19%
(3) 33%
10 Which weather condition most directly deter-
(2) 2%
(4) 40%
mines wind speeds at Earth’s surface?
(1) visibility changes
14 Which two minerals have cleavage planes at right
(2) amount of cloud cover
angles?
(3) air-pressure gradient
(1) biotite mica and muscovite mica
(4) dewpoint differences
(2) sulfur and amphibole
(3) quartz and calcite
11 Which statement best explains why an increase in
(4) halite and pyroxene
the relative humidity of a parcel of air generally
increases the chance of precipitation?
15 Which property would best distinguish sediment
(1) The dewpoint is farther from the condensa-
deposited by a river from sediment deposited by
tion point, causing rain.
a glacier?
(2) The air temperature is closer to the dewpoint,
(1) mineral composition of the sediment
making cloud formation more likely.
(2) amount of sediment sorting
(3) The amount of moisture in the air is greater,
(3) thickness of sediment layers
making the air heavier.
(4) age of fossils found in the sediment
(4) The specific heat of the moist air is greater
than the drier air, releasing energy.
P.S./E. Sci.–June ’07
[3]
[OVER]
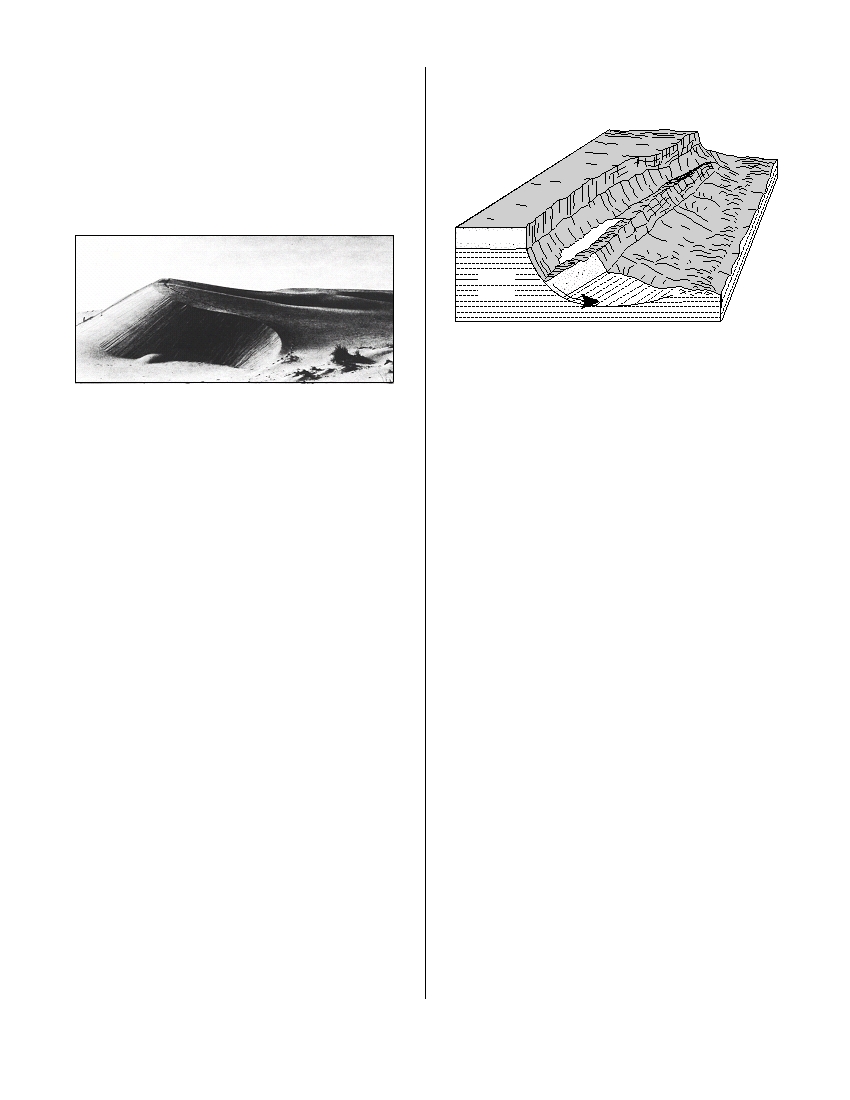
16 Salt deposits are found in the surface bedrock
21 The block diagram below shows a displacement
near which New York State location?
of rock layers.
(1) Oswego
(3) Old Forge
(2) Syracuse
(4) Albany
Cliff
17 The photograph below shows a sand dune that
formed in a coastal area.
Sandstone
ke
L a
Weak
shale
Which process describes the downward sliding of
the rock material?
(1) tidal changes
(3) mass movement
This sand dune was most likely formed by
(2) glacial erosion
(4) lava flow
(1) water flowing from the left
(2) water flowing from the right
(3) wind blowing from the left
22 The presence of which index fossil in the surface
(4) wind blowing from the right
bedrock most likely indicates that a forest envi-
ronment once existed in the region?
(1) Aneurophyton
(3) Centroceras
18 What is the origin of fine-grained igneous rock?
(2) Cystiphyllum
(4) Bothriolepis
(1) lava that cooled slowly on Earth’s surface
(2) lava that cooled quickly on Earth’s surface
(3) silt that settled slowly in ocean water
23 Which two types of rock are most commonly
(4) silt that settled quickly in ocean water
found as outcrops in New York State’s Newark
Lowlands landscape region?
(1) rock salt and gypsum
19 Why does the oceanic crust sink beneath the
(2) limestone and granite
continental crust at a subduction boundary?
(3) gneiss and quartzite
(1) The oceanic crust has a greater density.
(4) conglomerate and sandstone
(2) The oceanic crust is pulled downward by
Earth’s magnetic field.
(3) The continental crust has a more mafic com-
24 Which processes most likely formed the shale
position.
bedrock found near Ithaca, New York?
(4) The continental crust is pulled upward by the
(1) uplift and solidification
Moon’s gravity.
(2) burial and compaction
(3) heat and pressure
(4) melting and recrystallization
20 Based on fossil evidence, most scientists infer that
(1) life has not changed significantly throughout
Earth’s history
(2) life has evolved from complex to simple forms
(3) many organisms that lived on Earth have
become extinct
(4) mammals developed early in the Precambrian
time period
P.S./E. Sci.–June ’07
[4]

25 The symbols below are used to represent different regions of space.
Universe =
Earth =
Galaxy =
Solar system =
Which diagram shows the correct relationship between these four regions? [If one symbol
is within another symbol, that means it is part of, or included in, that symbol.]
( 1 )
( 3 )
( 2 )
( 4 )
26 A student in New York State looked toward the eastern horizon to observe sunrise at three different times
during the year. The student drew the following diagram that shows the positions of sunrise, A , B , and C,
during this one-year period.
A
B
C
Horizon
Northeast
East
Southeast
Which list correctly pairs the location of sunrise to the time of the year?
(1) A —June 21
(3) A —March 21
B —March 21
B —June 21
C —December 21
C —December 21
(2) A —December 21
(4) A —June 21
B —March 21
B —December 21
C —June 21
C —March 21
P.S./E. Sci.–June ’07
[5]
[OVER]
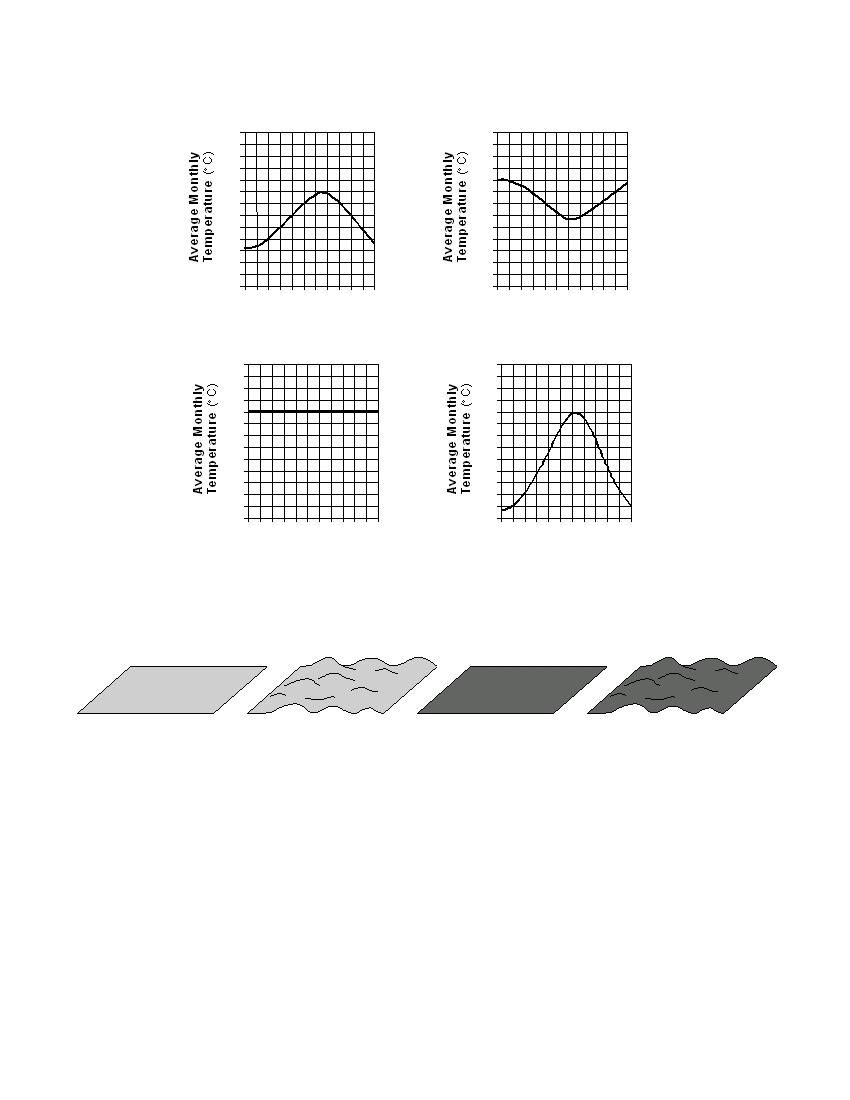
27 Which graph best represents the average monthly temperatures for one year at a location in the Southern
Hemisphere?
45
45
40
40
35
35
30
30
25
25
20
20
15
15
10
10
5
5
0
0
–5
–5
–10
–10
–15
–15
–20
–20
J F M A M J J A S O N D
J F M A M J J A S O N D
Month
Month
( 1 )
( 3 )
45
45
40
40
35
35
30
30
25
25
20
20
15
15
10
10
5
5
0
0
–5
–5
–10
–10
–15
–15
–20
–20
J F M A M J J A S O N D
J F M A M J J A S O N D
Month
Month
( 2 )
( 4 )
28 The diagram below shows four surfaces of equal area that absorb insolation.
A
B
C
D
Which letter represents the surface that most likely absorbs the greatest amount of
insolation?
(1) A
(3) C
(2) B
(4) D
P.S./E. Sci.–June ’07
[6]
29 Which station model shows the correct form for indicating a northwest wind at 25 knots and an air pressure
of 1023.7 mb?
1023.7
237
1023.7
237
( 1 )
( 2 )
( 3 )
( 4 )
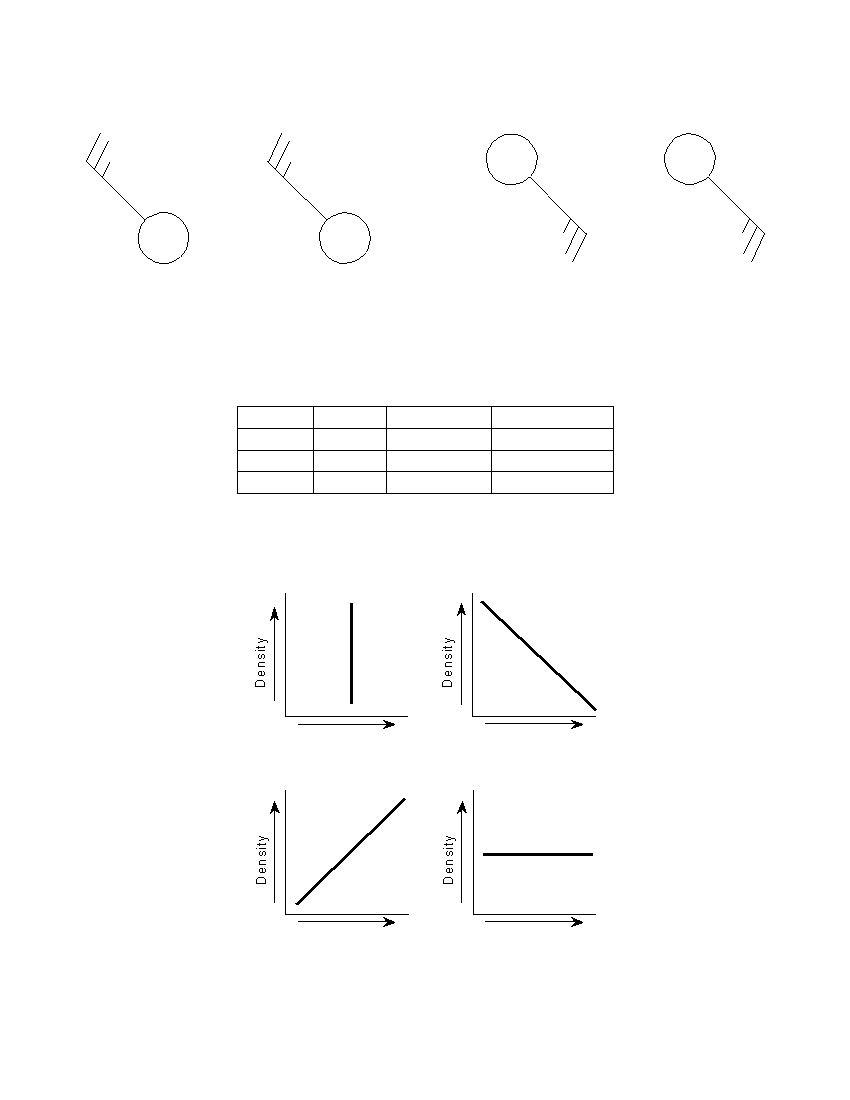
30 The data table below shows the mass and volume of three samples of the same mineral. [The density
column is provided for student use.]
Data Table
Sample
Mass (g)
Volume (cm 3 )
Density (g/cm 3 )
A
50
25
B
100
50
C
150
75
Which graph best represents the relationship between the density and the volume of
these mineral samples?
Volume
Volume
( 1 )
( 3 )
Volume
Volume
( 2 )
( 4 )
P.S./E. Sci.–June ’07
[7]
[OVER]
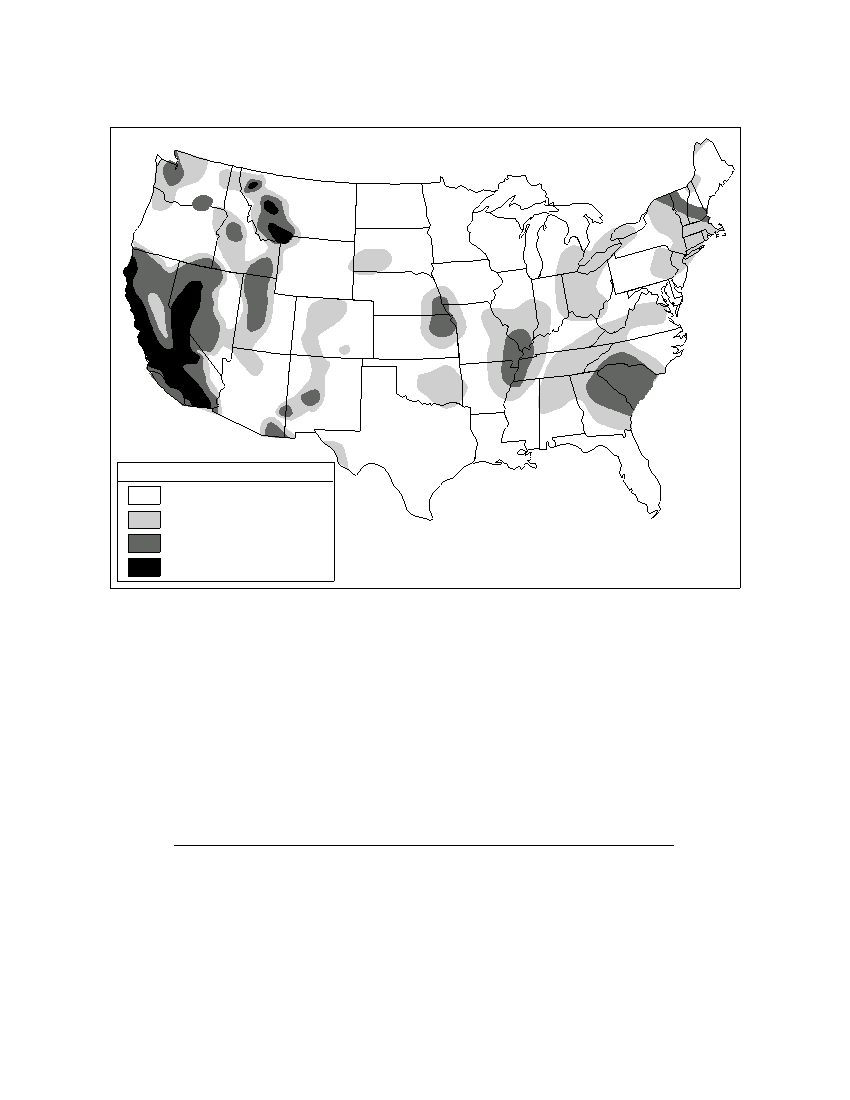
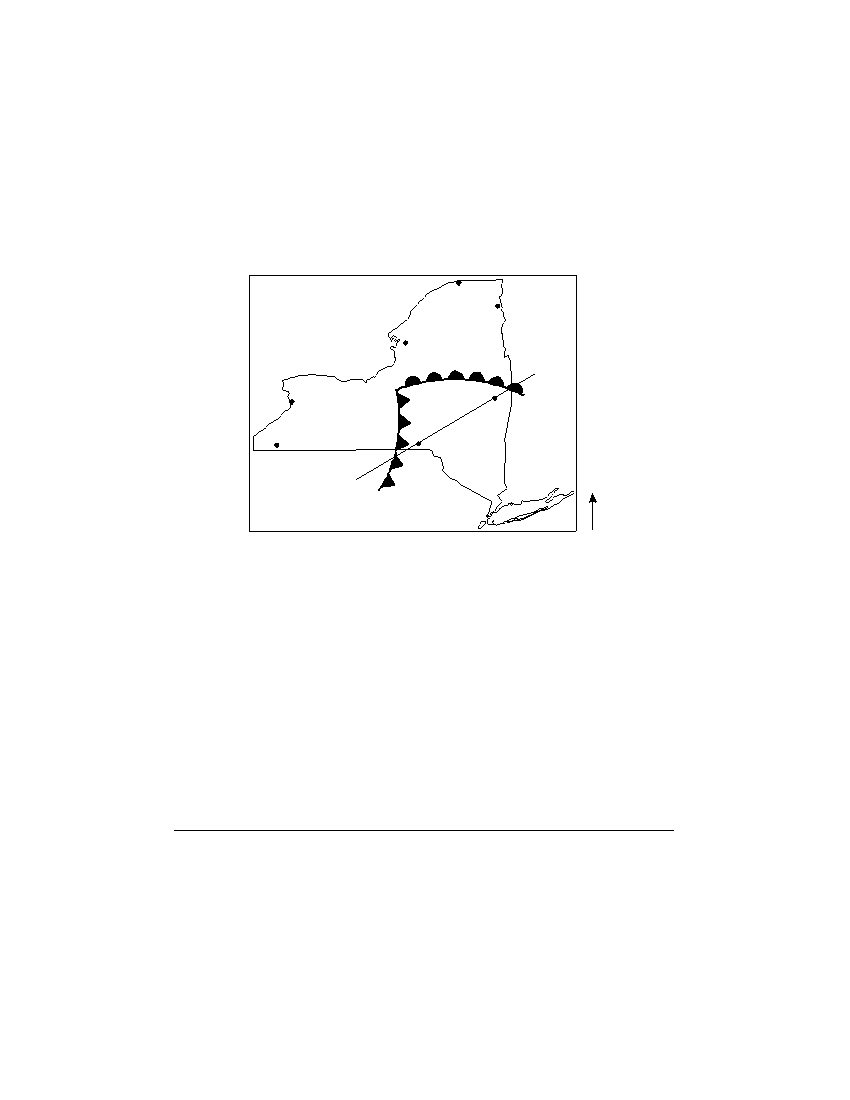
Base your answers to questions 31 and 32 on the map below, which shows the risk of damage from seismic
activity in the United States.
Key
NoDamage
MinorDamage
Moderate Damage
Major to Extreme Damage
31 In the United States, most of the major damage expected from a future earthquake
is predicted to occur near a
(1) divergent plate boundary, only
(2) convergent plate boundary, only
(3) mid-ocean ridge and a divergent plate boundary
(4) transform plate boundary and a hot spot
32 Which New York State location has the greatest risk of earthquake damage?
(1) Binghamton
(3) Plattsburgh
(2) Buffalo
(4) Elmira
P.S./E. Sci.–June ’07
[8]
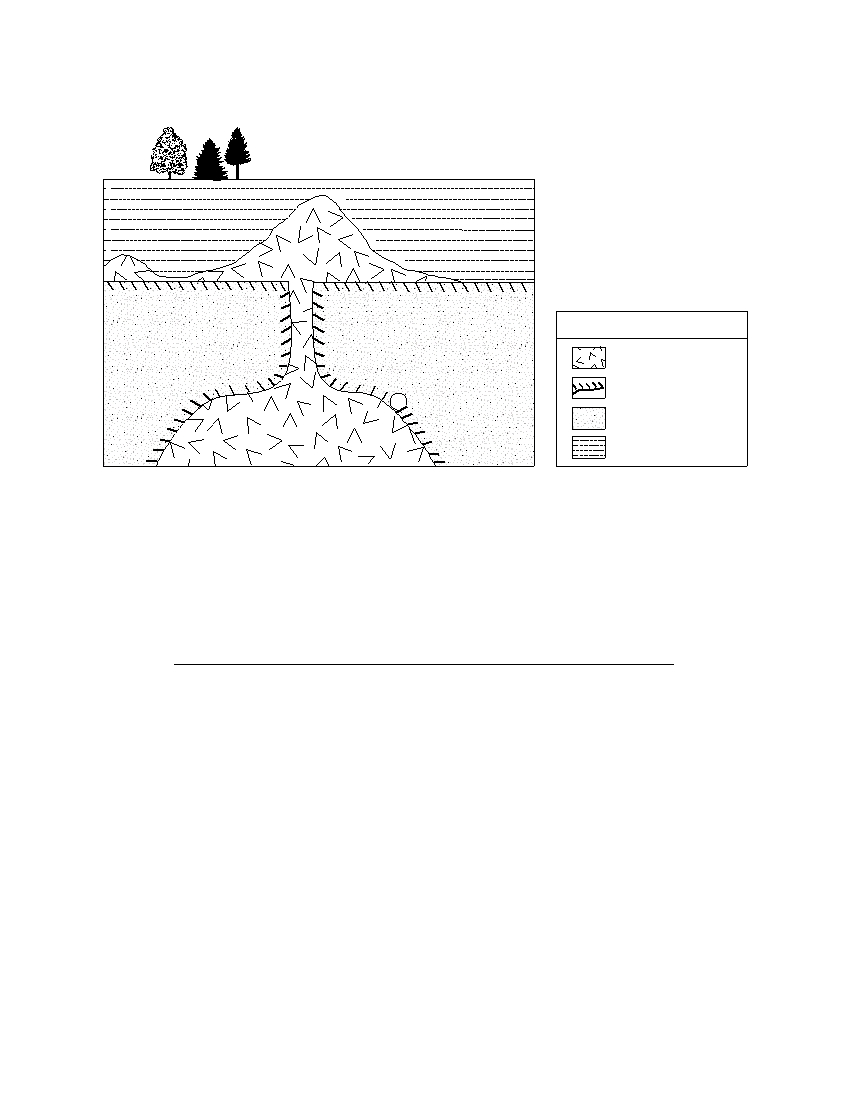
Base your answers to questions 33 and 34 on the geologic cross section below. Location A is within the
metamorphic rock.
Key
Igneous rock
Contact metamorphic
A
rock
Sandstone
Shale
33 The metamorphic rock at location A is most likely
(1) marble
(3) phyllite
(2) quartzite
(4) slate
34 Which rock is the youngest?
(1) shale
(3) igneous rock
(2) sandstone
(4) rock at location A
P.S./E. Sci.–June ’07
[9]
[OVER]
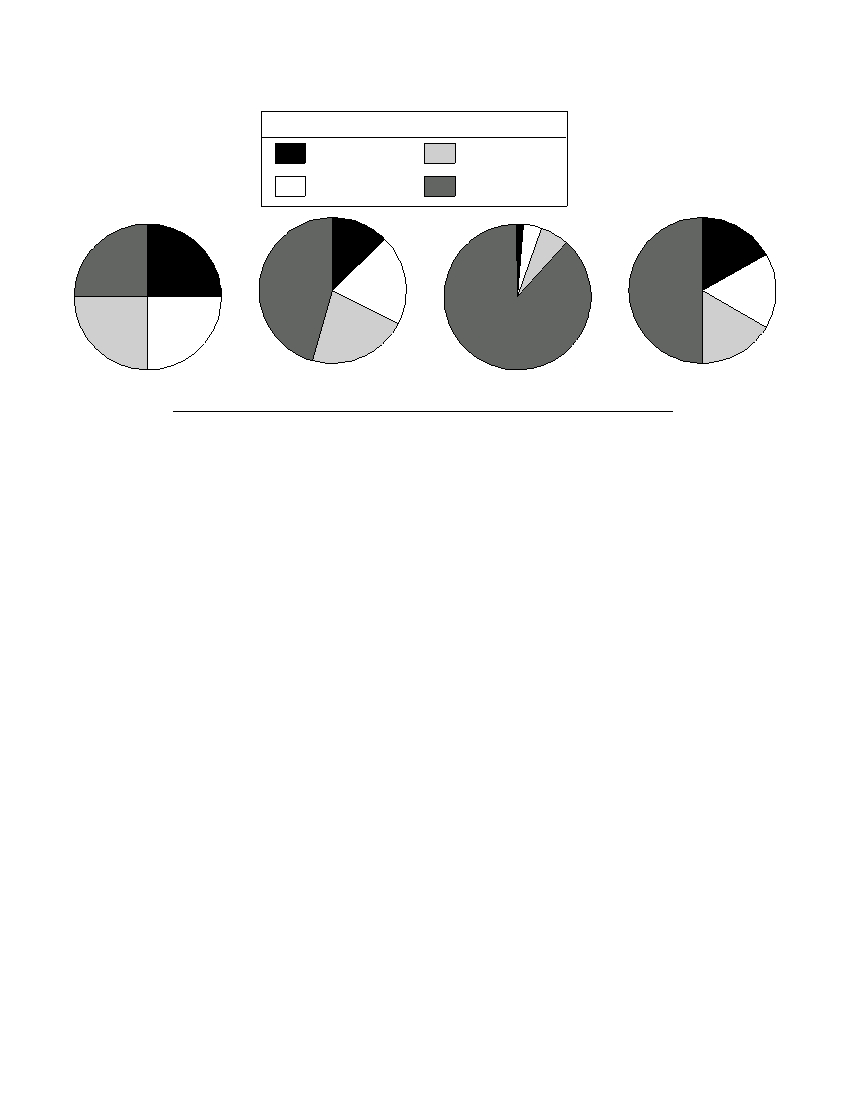
35 Which pie graph best represents the percentage of total time for the four major divisions of geologic time?
Key
Cenozoic
Paleozoic
Mesozoic
Precambrian
( 1 )
( 2 )
( 3 )
( 4 )
P.S./E. Sci.–June ’07
[10]
Part B–1
Answer all questions in this part.
Directions (36–50): For each statement or question, write on your separate answer sheet the number of the
word or expression that, of those given, best completes the statement or answers the question. Some questions
may require the use of the Earth Science Reference Tables .
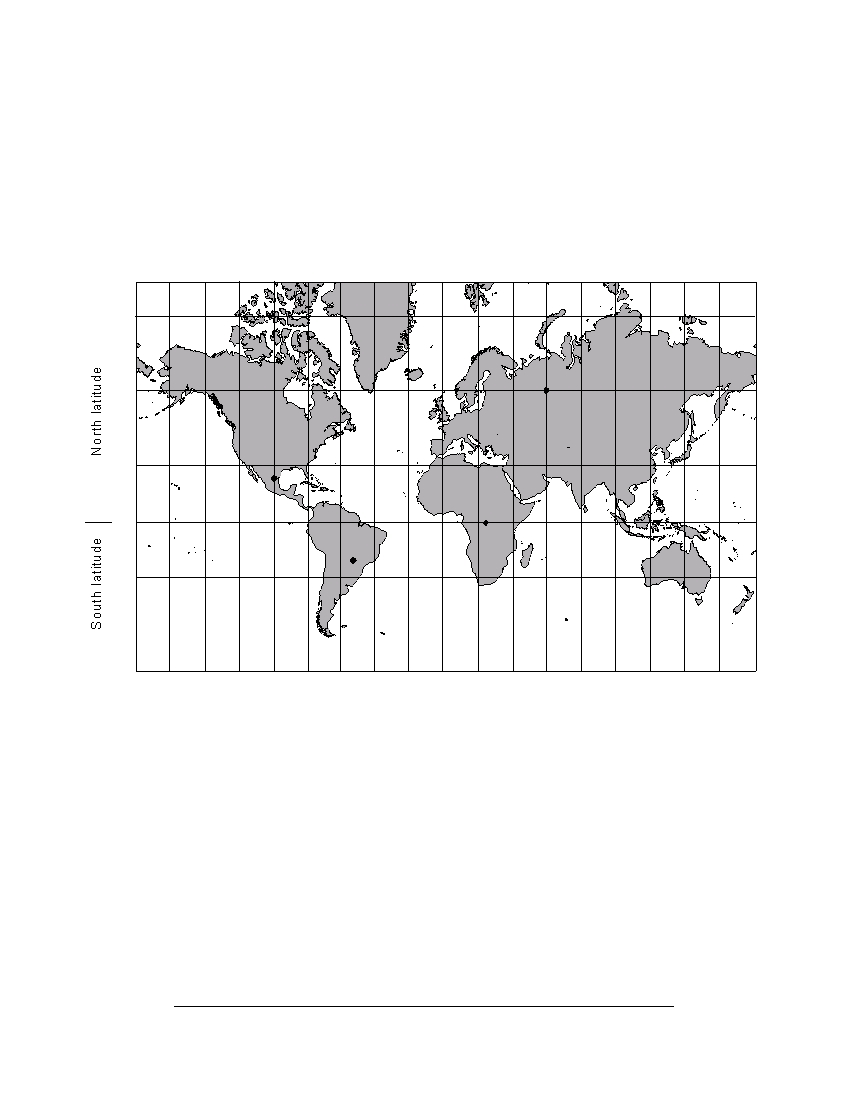
Base your answers to questions 36 through 38 on the world map below. Letters A through D represent
locations on Earth’s surface.
180 °
160 °
140 °
120 °
100 °
80 °
60 °
40 °
20 °
0 °
20 °
40 °
60 °
80 °
100 °
120 °
140 °
160 °
180 °
75 °
75 °
60 °
D
60 °
30 °
A
30 °
0 °
C
0 °
B
30 °
30 °
180 °
160 °
140 °
120 °
100 °
80 °
60 °
40 °
20 °
0 °
20 °
40 °
60 °
80 °
100 °
120 °
140 °
160 °
180 °
West longitude
East longitude
36 At which location could an observer not see Polaris in the night sky at any time
during the year?
(1) A
(3) C
(2) B
(4) D
37 Which location receives 12 hours of daylight and 12 hours of darkness on June 21?
(1) A
(3) C
(2) B
(4) D
38 At which location on December 21 is the Sun directly overhead at solar noon?
(1) A
(3) C
(2) B
(4) D
P.S./E. Sci.–June ’07
[11]
[OVER]

Base your answers to questions 39 through 42 on the table below, which shows eight inferred stages describing
the formation of the universe from its beginning to the present time.
Data Table
Average
Time From the
Temperature of
Stage
Description of the Universe
Beginning of
the Universe
Universe
(°C)
1
the size of an atom
?
0 second
2
the size of a grapefruit
?
10 –43 second
3
“hot soup” of electrons
10 27
10 –32 second
4
Cooling allows protons and neutrons to form.
10 13
10 –6 second
5
still too hot to allow the forming of atoms
10 8
3 minutes
Electrons combine with protons and neutrons,
6
forming hydrogen and helium atoms. Light emission
10,000
300,000 years
begins.
Hydrogen and helium form giant clouds (nebulae)
7
–200
1 billion years
that will become galaxies. First stars form.
Galaxy clusters form and first stars die. Heavy
8
elements are thrown into space, forming new stars
–270
13.7 billion years
and planets.
39 How soon did protons and neutrons form after the beginning of the universe?
(1) 10 –43 second
(3) 10 –6 second
(2) 10 –32 second
(4) 13.7 billion years
40 What is the most appropriate title for this table?
(1) The Big Bang Theory
(3) The Law of Superposition
(2) The Theory of Plate Tectonics
(4) The Laws of Planetary Motion
41 According to this table, the average temperature of the universe since stage 3 has
(1) decreased, only
(3) remained the same
(2) increased, only
(4) increased, then decreased
42 Between which two stages did our solar system form?
(1) 1 and 3
(3) 6 and 7
(2) 3 and 5
(4) 7 and 8
P.S./E. Sci.–June ’07
[12]
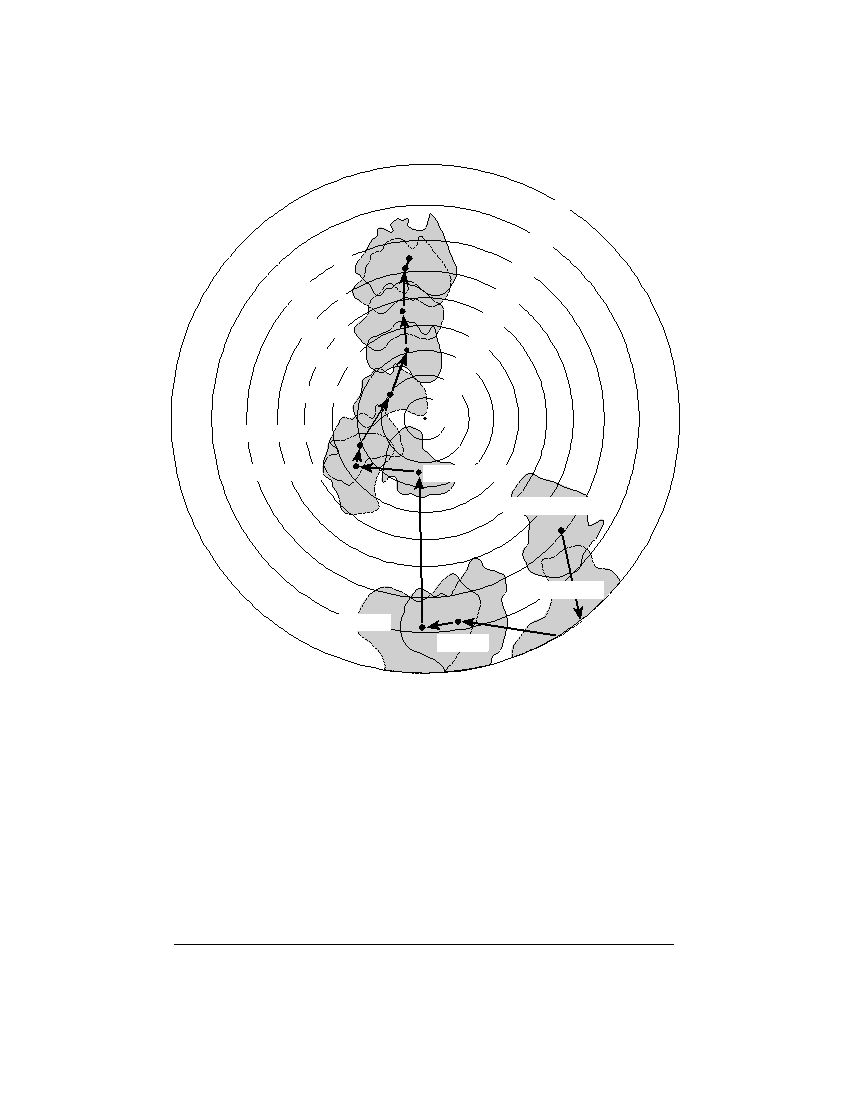
Base your answers to questions 43 and 44 on the map below, which shows Earth’s Southern Hemisphere and
the inferred tectonic movement of the continent of Australia over geologic time. The arrows between the dots
show the relative movement of the center of the continent of Australia. The parallels of latitude from 0° to
90° south are labeled.
0 °
10 °
Present
20 °
Pliocene
30 °
40 °
Eocene
50 °
Jurassic
60 °
Triassic
70 °
80 °
90 °
Late Permian
Early Permian
Carboniferous
Late Proterozoic
Cambrian
Devonian
Silurian
43 The geographic position of Australia on Earth’s surface has been changing mainly
because
(1) the gravitational force of the Moon has been pulling on Earth’s landmasses
(2) heat energy has been creating convection currents in Earth’s interior
(3) Earth’s rotation has spun Australia into different locations
(4) the tilt of Earth’s axis has changed several times
44 During which geologic time interval did Australia most likely have a warm, tropical
climate because of its location?
(1) Cambrian
(3) Late Permian
(2) Carboniferous
(4) Eocene
P.S./E. Sci.–June ’07
[13]
[OVER]
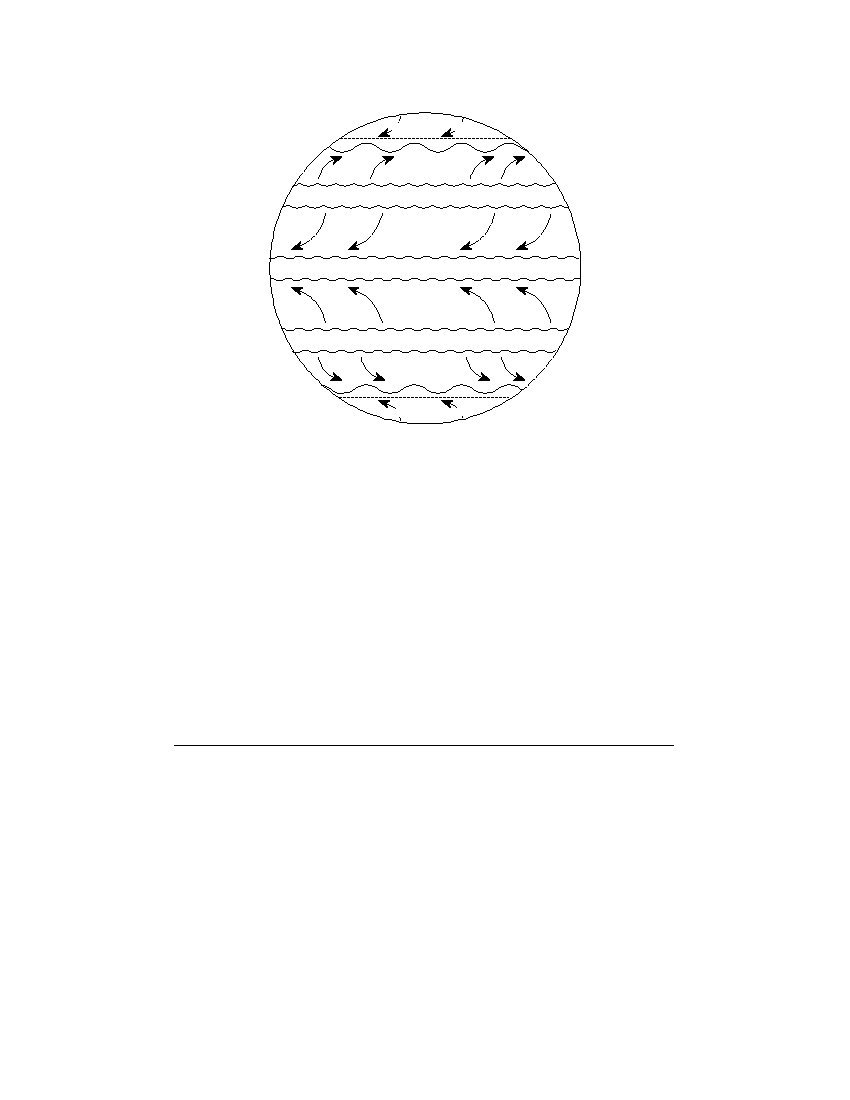
Base your answers to questions 45 through 47 on the map below, which shows Earth’s planetary wind belts.
Polar Easterlies
Wet
60 ° N
Prevailing
Southwesterlies
Dry
30 ° N
Northeast
Trades
Wet
0 °
Southeast
Trades
Dry
30 ° S
Prevailing
Northwesterlies
Wet
60 ° S
Polar Easterlies
45 The curving of these planetary winds is the result of
(1) Earth’s rotation on its axis
(2) the unequal heating of Earth’s atmosphere
(3) the unequal heating of Earth’s surface
(4) Earth’s gravitational pull on the Moon
46 Which wind belt has the greatest effect on the climate of New York State?
(1) prevailing northwesterlies
(3) northeast trades
(2) prevailing southwesterlies
(4) southeast trades
47 Which climatic conditions exist where the trade winds converge?
(1) cool and wet
(3) warm and wet
(2) cool and dry
(4) warm and dry
P.S./E. Sci.–June ’07
[14]
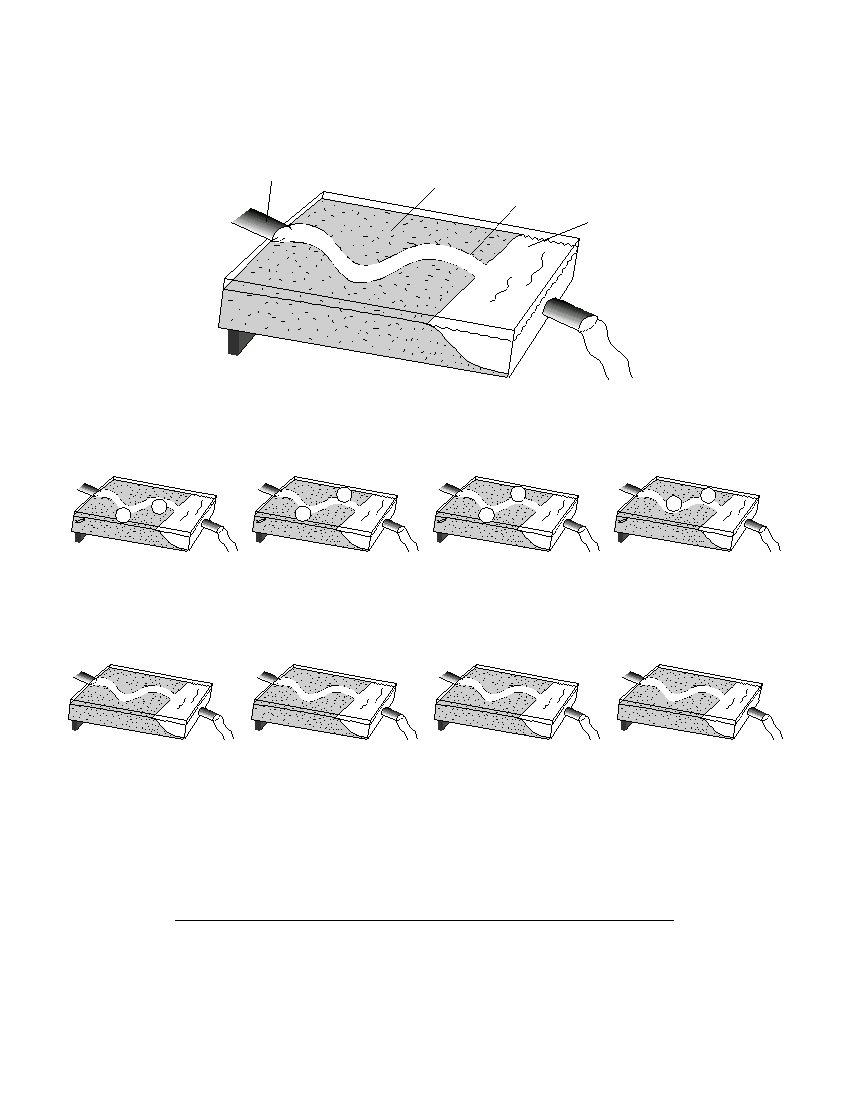
Base your answers to questions 48 through 50 on the diagram below, which shows a model used to
investigate the erosional-depositional system of a stream. The model was tilted to create a gentle slope, and a
hose supplied water to form the meandering stream shown.
Hose to
supply water
Mixed sediment
Meandering stream
Water basin
48 Which diagram best represents where erosion, E , and deposition, D , are most likely
occurring along the curves of the meandering stream?
E
D
E
D
E
D
D
E
( 1 )
( 2 )
( 3 )
( 4 )
49 Which diagram best represents the arrangement of large, L , and small, S , sediment
deposited as the stream enters the water basin?
L
S
L
L
S
S
S
L
( 1 )
( 2 )
( 3 )
( 4 )
50 How can the model be changed to increase the amount of sediment transported by
the stream?
(1) decrease the temperature of the sediment
(2) decrease the slope
(3) increase the size of the sediment
(4) increase the rate of the water flow
P.S./E. Sci.–June ’07
[15]
[OVER]
Part B–2
Answer all questions in this part.
Directions (51–64): Record your answers in the spaces provided in your answer booklet. Some questions
may require the use of the Earth Science Reference Tables.
Base your answers to questions 51 through 53 on the weather map below. The weather map shows a low-
pressure system in New York State during July. The L represents the center of the low-pressure system. Two
fronts extend from the center of the low. Line XY on the map is a reference line.
Massena
Plattsburgh
Watertown
L
Y
Buffalo
Albany
Jamestown
Binghamton
X
N
New York City
51 The cross section in your answer booklet shows a side view of the area along line XY
on the map. On lines 1 and 2 in the cross section, place the appropriate two-letter
air-mass symbols to identify the most likely type of air mass at each of these locations.
[ 1 ]
52 The forecast for one city located on the map is given below:
“In the next hour, skies will become cloud covered. Heavy rains are expected
with possible lightning and thunder. Temperatures will become much cooler.”
State the name of the city for which this forecast was given. [ 1 ]
53 Identify one action that people should take to protect themselves from lightning. [ 1 ]
P.S./E. Sci.–June ’07
[16]
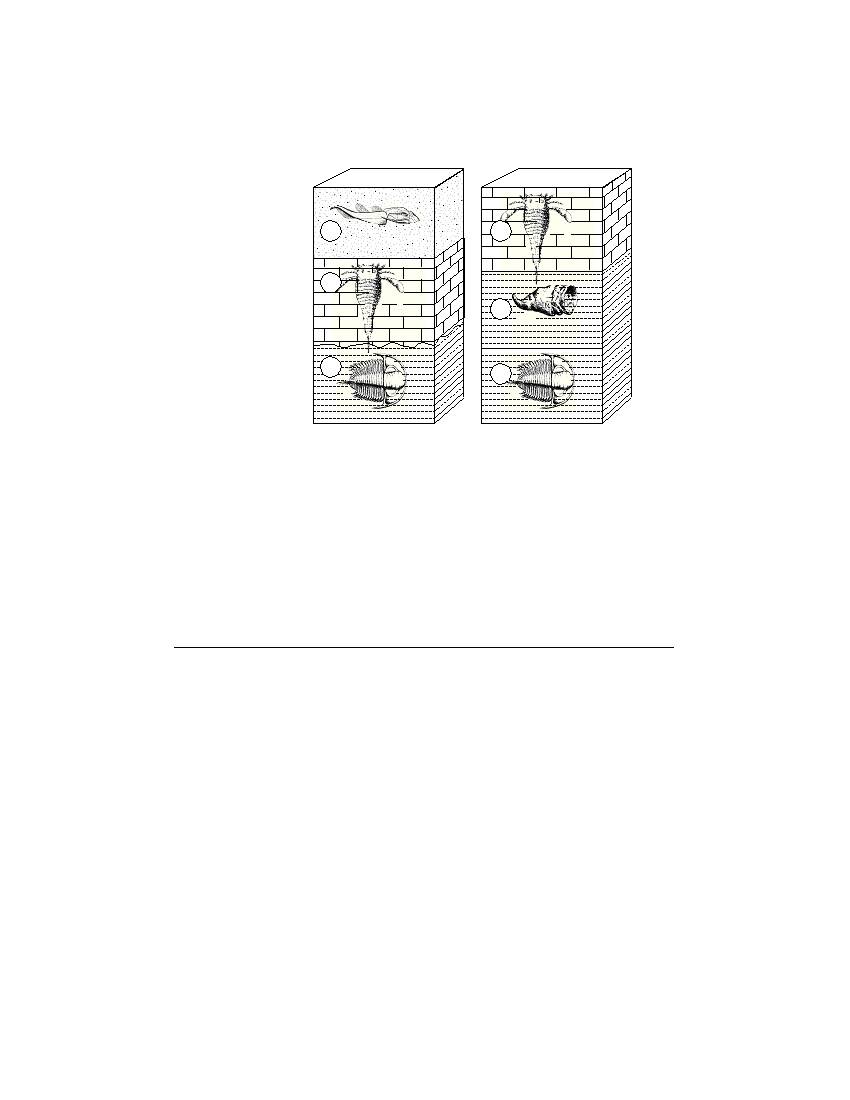
Base your answers to questions 54 through 57 on the diagrams below, which represent two bedrock
outcrops, I and II, found several kilometers apart in New York State. Rock layers are lettered A through F .
Drawings represent specific index fossils.
I
II
A
D
B
E
Unconformity
C
F
54 During which geologic time period was rock layer C deposited? [ 1 ]
55 Identify two processes that produced the unconformity in outcrop I. [ 1 ]
56 Describe one characteristic a fossil must have in order to be considered a good index
fossil. [ 1 ]
57 Explain why carbon-14 can not be used to find the geologic age of these index fossils. [ 1 ]
P.S./E. Sci.–June ’07
[17]
[OVER]
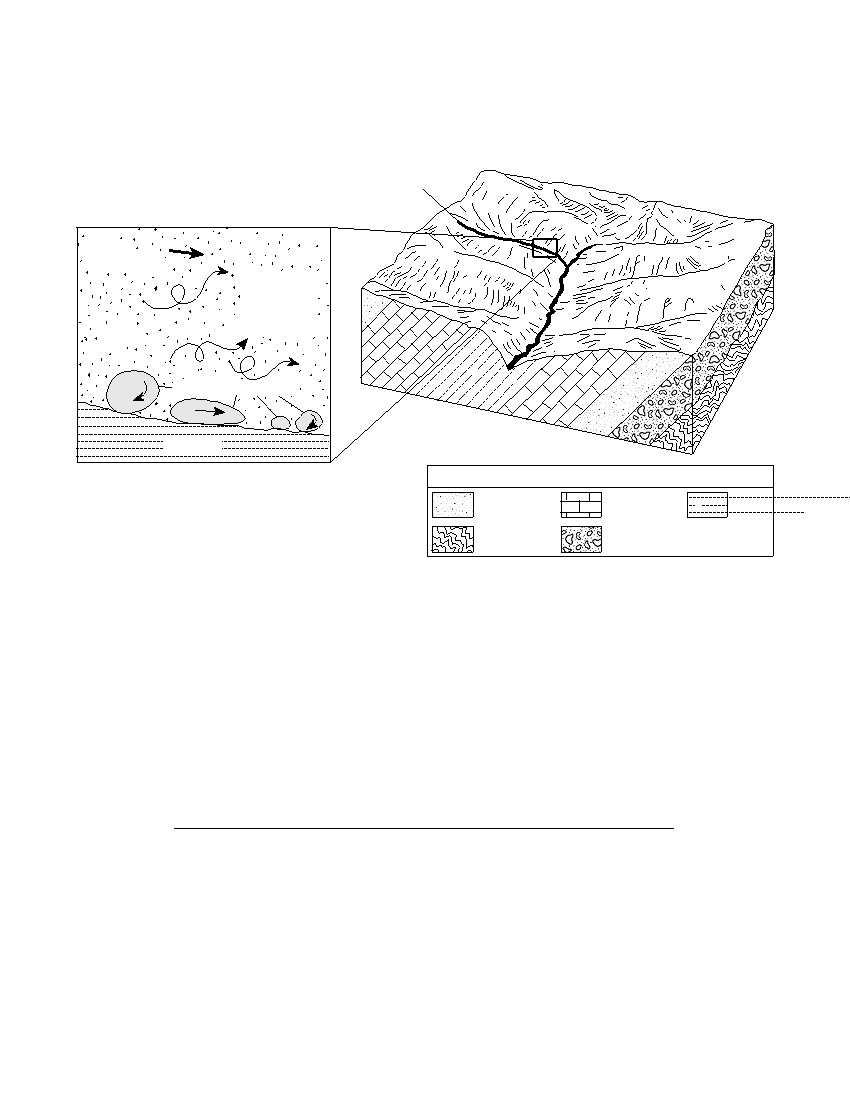
Base your answers to questions 58 through 61 on the cross section and block diagram below. The cross
section shows an enlarged view of the stream shown in the block diagram. The sediments in the cross section
are drawn to actual size. Arrows show the movement of particles in the stream. The block diagram represents
a region of Earth’s surface and the bedrock beneath the region.
Stream
Block Diagram
Cross-Sectional View
Direction
stream
of
flow
Very small
particles
suspended
by turbulence
Sediment particles
Bedrock
Key
Sandstone
Limestone
Shale
Gneiss
Conglomerate
58 After measuring the actual size, identify the name of the largest particle shown on the
stream bottom in the cross section. [ 1 ]
59 What process is responsible for producing the rounded shape of the particles shown
on the stream bottom in the cross section? [ 1 ]
60 Identify the type of rock shown in the block diagram that appears to be the most easily
eroded. [ 1 ]
61 How does the shape of a valley eroded by a glacier differ from the shape of the
valley shown in the block diagram? [ 1 ]
P.S./E. Sci.–June ’07
[18]
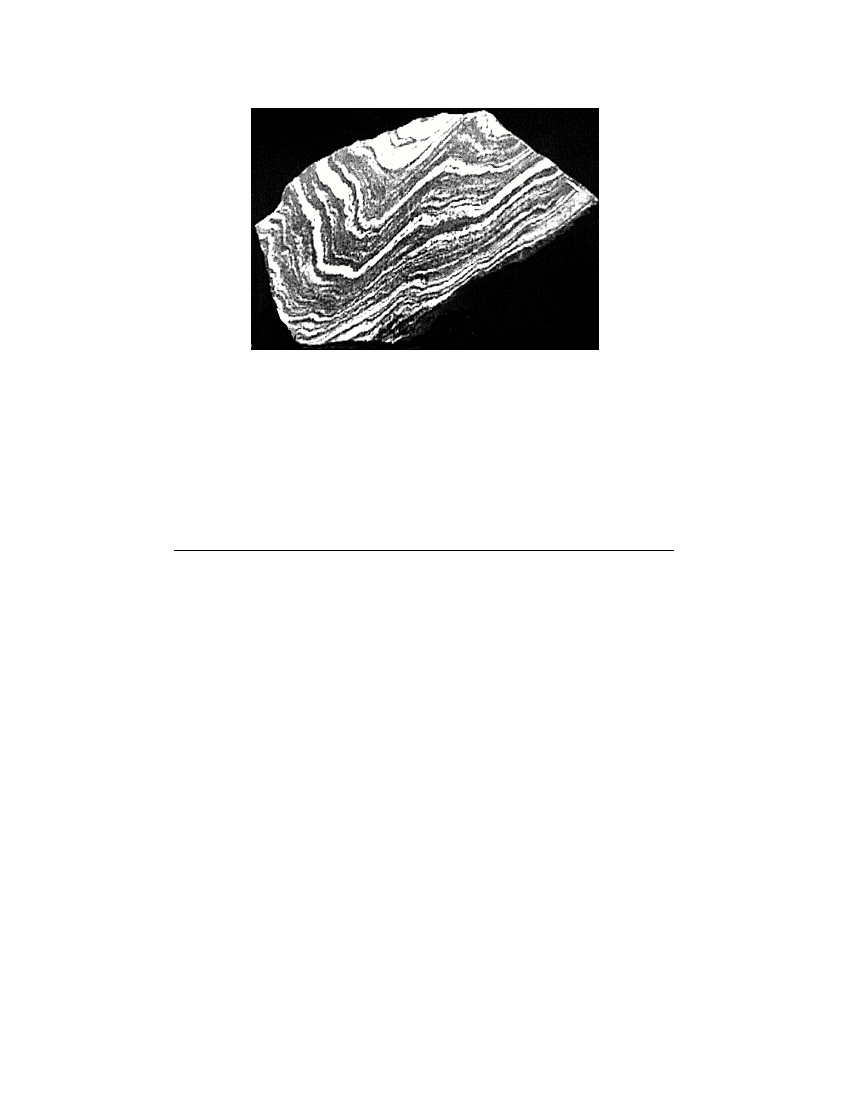
Base your answers to questions 62 through 64 on the photograph of a sample of gneiss below.
62 What observable characteristic could be used to identify this rock sample as gneiss?
[ 1 ]
63 Identify two minerals found in gneiss that contain iron and magnesium. [ 1 ]
64 A dark-red mineral with a glassy luster was also observed in this gneiss sample.
Identify the mineral and state one possible use for this mineral. [ 1 ]
P.S./E. Sci.–June ’07
[19]
[OVER]
Part C
Answer all questions in this part.
Directions (65–82): Record your answers in the spaces provided in your answer booklet. Some questions
may require the use of the Earth Science Reference Tables.
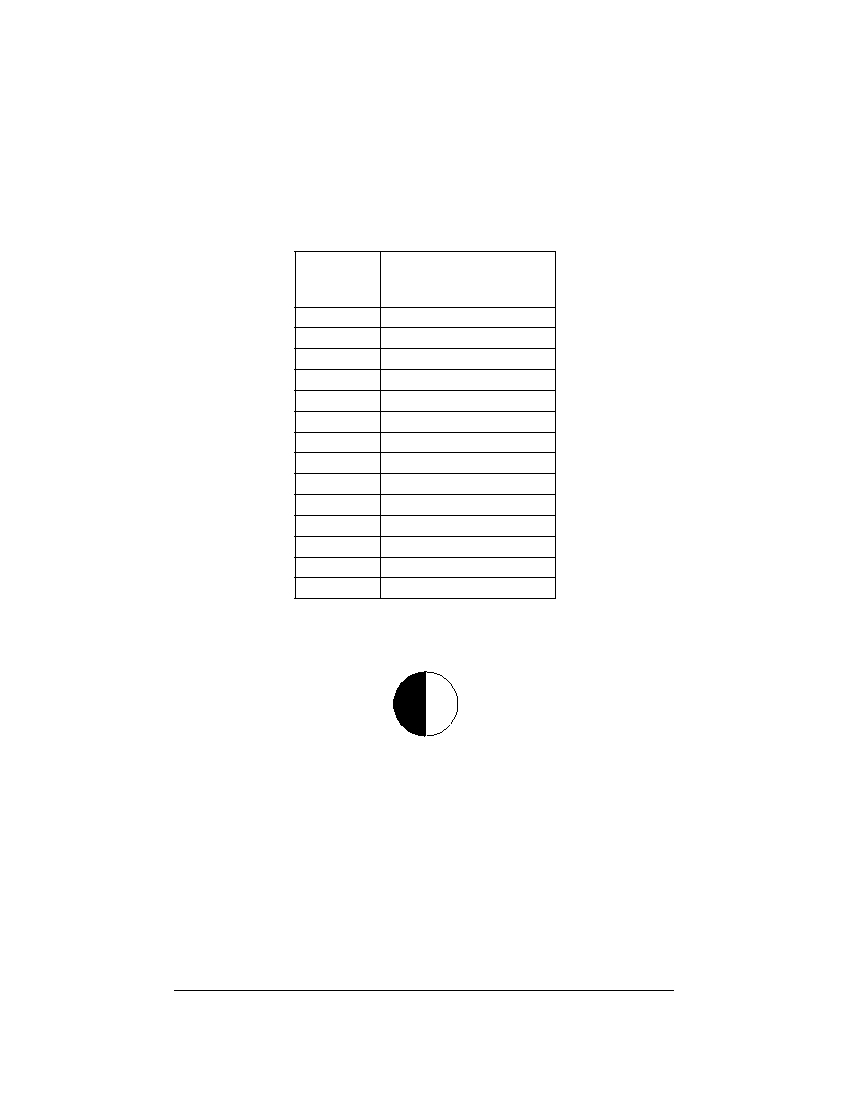
Base your answers to questions 65 through 69 on the data table below, which shows the percentage of the
lighted side of the Moon visible from Earth for the first fourteen days of July 2003.
Percentage of Lighted
Date
Side of the Moon Visible
From Earth (%)
July 1
1
July 2
5
July 3
10
July 4
17
July 5
26
July 6
37
July 7
48
July 8
59
July 9
70
July 10
80
July 11
89
July 12
95
July 13
98
July 14
100
65 On what July date listed in the table did the Moon appear as shown below? [ 1 ]
66 What motion of the Moon causes the percentage of the lighted side of the Moon
visible from Earth to change from July 1 to July 14? [ 1 ]
67 A full Moon phase was observed on July 14. On what day in August was the next full
Moon phase observed? [ 1 ]
68 The diagram in your answer booklet shows the orbit of the Moon around Earth.
Place an X on the orbit to show where the Moon was in its orbit on July 14, 2003. [ 1 ]
69 Why are the phases of the Moon considered to be cyclic? [ 1 ]
P.S./E. Sci.–June ’07
[20]
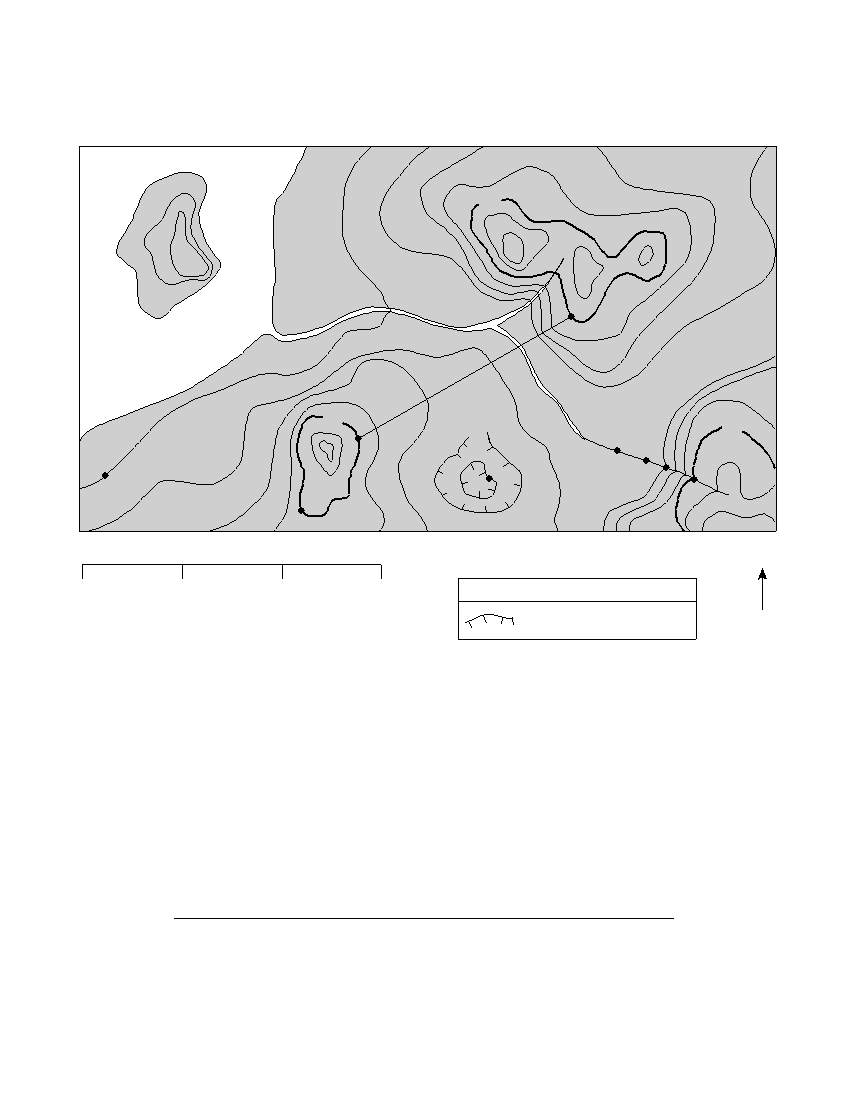
Base your answers to questions 70 through 73 on the topographic map shown below. Letters A , B , C , D ,
and E represent locations on Earth’s surface. Letters K , L , M , and N are locations along Copper Creek.
Elevations are measured in meters.
50
t h y s t R i v e r
A m
e
E
Ocean
C
o
p
p
e
r C
50
D
r e
20
e
k
50
L
B
K
A
M
N
C
Contour interval = 10 meters
N
0
1
2
3 km
Key
Depression contour line
70 What is the elevation of location A ? [ 1 ]
71 Calculate the gradient between points B and C and label your answer with the
correct units. [ 2 ]
72 On the grid in your answer booklet , construct a topographic profile along line DE by
plotting an X for the elevation of each contour line that crosses line DE . Connect the
X s with a smooth, curved line to complete the profile. [ 2 ]
73 Explain how the map indicates that Copper Creek flows faster between points N and
M than between points L and K . [ 1 ]
P.S./E. Sci.–June ’07
[21]
[OVER]
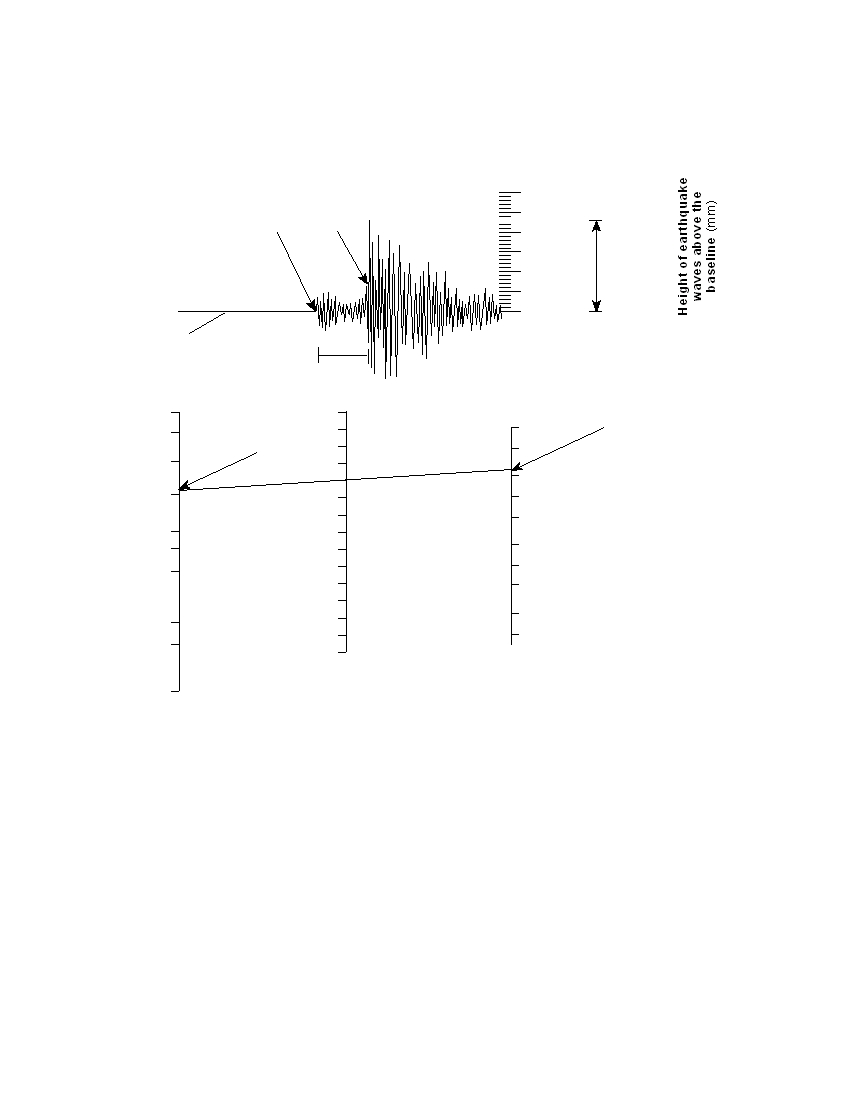
Base your answers to questions 74 through 76 on the example of a seismogram and set of instructions for
determining the Richter magnitude of an earthquake below. The example shows the Richter magnitude of an
earthquake 210 kilometers from a seismic station.
Example of a Seismogram of an Earthquake
30
P-wave S-wave
arrival
arrival
20
10 Height = 23 mm
0
Baseline
30
seconds
Height of largest
500
7
S-wave (23 mm)
400
Determined distance
100
to epicenter (210 km) 6
50
300
5
20
200
10
4
5
100
60
3
2
40
1
2
0.5
0.2
20
1
0.1
5
0
Richter
Height of largest
S-wave (mm)
0
magnitude
Distance to
epicenter
(km)
Instructions for determining Richter magnitude:
210 kilometers.)
in the example is 23 millimeters.)
the largest S -wave (23 millimeters) on the appropriate scales. Draw a line connecting these
two points. The magnitude of the earthquake is determined by where the line intersects the
Richter magnitude scale. (The magnitude of this example is 5.0.)
P.S./E. Sci.–June ’07
[22]
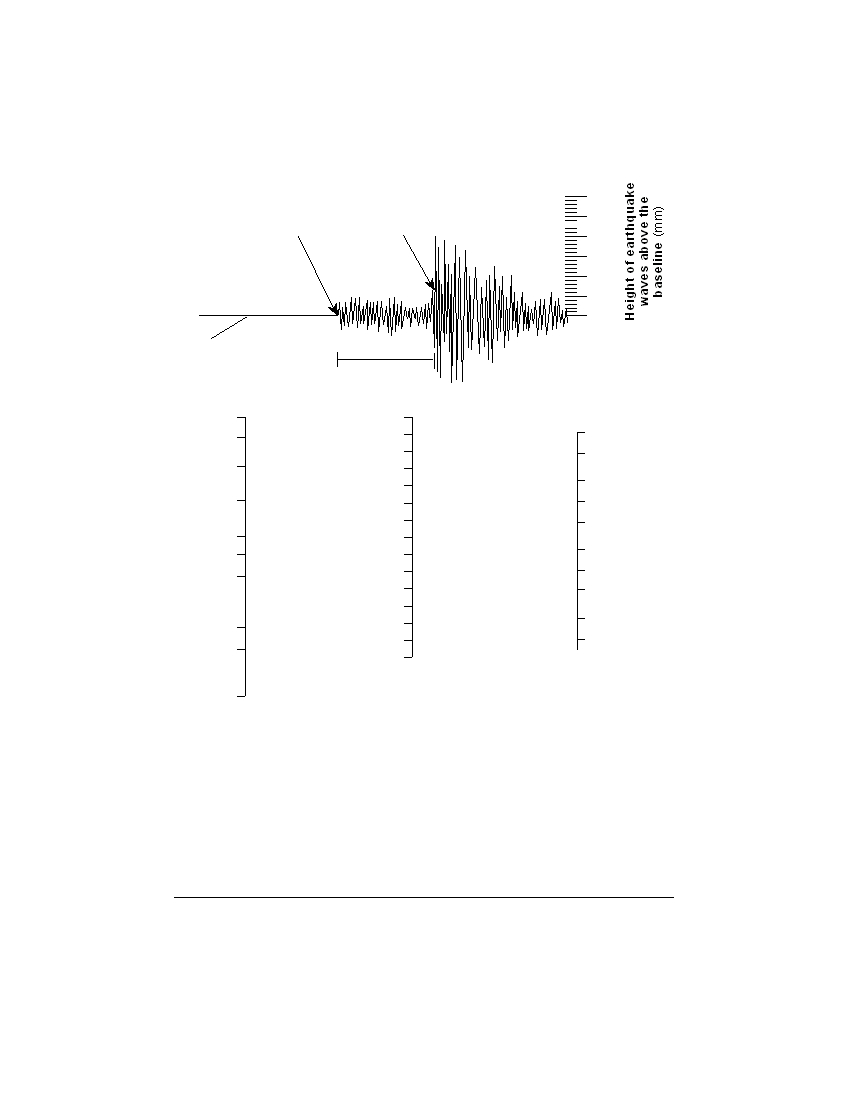
74 Using the set of instructions on page 22 and the seismogram and scales below, determine
the Richter magnitude of an earthquake that was located 500 kilometers from this
seismic station. Record your answer in your answer booklet . [ 1 ]
Seismogram of an Earthquake
30
P-wave
S-wave
arrival
arrival
20
10
0
Baseline
61
seconds
500
7
400
100
6
50
300
5
20
200
10
4
5
100
60
3
2
40
1
2
0.5
0.2
20
1
0.1
5
0
Richter
Height of largest
S-wave (mm)
0
magnitude
Distance to
epicenter
(km)
75 Identify the information shown on the seismogram that was used to determine that
the distance to the epicenter was 500 kilometers. [ 1 ]
76 How long did it take the first S -wave to travel 500 kilometers to reach this seismic
station? [ 1 ]
P.S./E. Sci.–June ’07
[23]
[OVER]

Base your answers to questions 77 through 81 on the passage below and on the map in your answer booklet.
The passage describes the Gakkel Ridge found at the bottom of the Arctic Ocean. The map shows the location
of the Gakkel Ridge.
The Gakkel Ridge
In the summer of 2001, scientists aboard the U.S. Coast Guard icebreaker
Healy visited one of the least explored places on Earth. The scientists studied the
1800-kilometer-long Gakkel Ridge at the bottom of the Arctic Ocean near the
North Pole. The Gakkel Ridge is a section of the Arctic Mid-Ocean Ridge and
extends from the northern end of Greenland across the Arctic Ocean floor toward
Russia. At a depth of about 5 kilometers below the ocean surface, the Gakkel
Ridge is one of the deepest mid-ocean ridges in the world. The ridge is believed
to extend down to Earth’s mantle, and the new seafloor being formed at the ridge
is most likely composed of huge slabs of mantle rock. Bedrock samples taken from
the seafloor at the ridge were determined to be the igneous rock peridotite.
The Gakkel Ridge is also the slowest moving mid-ocean ridge. Some ridge
systems, like the East Pacific Ridge, are rifting at a rate of about 20 centimeters
per year. The Gakkel Ridge is rifting at an average rate of less than 1 centimeter
per year. This slow rate of movement means that there is less volcanic activity
along the Gakkel Ridge than along other ridge systems. However, heat from the
underground magma slowly seeps up through cracks in the rocks of the ridge at
structures scientists call hydrothermal (hot water) vents. During the 2001 cruise,
a major hydrothermal vent was discovered at 87° N latitude 45° E longitude.
77 On the map in your answer booklet , place an X on the location of the major hydro-
thermal vent described in the passage. [ 1 ]
78 Describe the relative motion of the two tectonic plates on either side of the Gakkel
Ridge. [ 1 ]
79 The Gakkel Ridge is a boundary between which two tectonic plates? [ 1 ]
80 Identify one feature, other than hydrothermal vents, often found at mid-ocean ridges
like the Gakkel Ridge that indicates heat from Earth’s interior is escaping. [ 1 ]
81 State the two minerals that were most likely found in the igneous bedrock samples
collected at the Gakkel Ridge. [ 1 ]
82 The diagram in your answer booklet shows a view of the ground from directly above
a flagpole in New York State at solar noon on a particular day of the year. The
flagpole’s shadow at solar noon is shown. Draw the position and relative length of the
shadow that would be cast by this flagpole three hours later. [ 2 ]
P.S./E. Sci.–June ’07
[24]


The University of the State of New York
R EGENTS H IGH S CHOOL E XAMINATION
PHYSICAL SETTING
EARTH SCIENCE
Tuesday, June 19, 2007 — 9:15 a.m. to 12:15 p.m., only
ANSWER SHEET
Student . . . . . . . . . . . . . . . . . . . . . . . . . . . . . . . . . . . . . . . . . . . . . . .
Sex:
I Male I Female
Grade . . . . . . . . . . . .
Teacher . . . . . . . . . . . . . . . . . . . . . . . . . . . . . . . . . . . . . . . . . . . . . . .
School . . . . . . . . . . . . . . . . . . . . . . . . . . . . . . . . . . . .
Record your answers to Part A and Part B–1 on this answer sheet.
Part A
Part B–1
1 . . . . . . . . . . . .
13 . . . . . . . . . . . .
25 . . . . . . . . . . .
36 . . . . . . . . . . . .
44 . . . . . . . . . . . .
2 . . . . . . . . . . . .
14 . . . . . . . . . . . .
26 . . . . . . . . . . .
37 . . . . . . . . . . . .
45 . . . . . . . . . . . .
3 . . . . . . . . . . . .
15 . . . . . . . . . . . .
27 . . . . . . . . . . .
38 . . . . . . . . . . . .
46 . . . . . . . . . . . .
4 . . . . . . . . . . . .
16 . . . . . . . . . . . .
28 . . . . . . . . . . .
39 . . . . . . . . . . . .
47 . . . . . . . . . . . .
5 . . . . . . . . . . . .
17 . . . . . . . . . . . .
29 . . . . . . . . . . .
40 . . . . . . . . . . . .
48 . . . . . . . . . . . .
6 . . . . . . . . . . . .
18 . . . . . . . . . . . .
30 . . . . . . . . . . .
41 . . . . . . . . . . . .
49 . . . . . . . . . . . .
7 . . . . . . . . . . . .
19 . . . . . . . . . . . .
31 . . . . . . . . . . .
42 . . . . . . . . . . . .
50 . . . . . . . . . . . .
Part B–1 Score
8 . . . . . . . . . . . .
20 . . . . . . . . . . . .
32 . . . . . . . . . . .
43 . . . . . . . . . . . .
9 . . . . . . . . . . . .
21 . . . . . . . . . . . .
33 . . . . . . . . . . .
10 . . . . . . . . . . . .
22 . . . . . . . . . . . .
34 . . . . . . . . . . .
11 . . . . . . . . . . . .
23 . . . . . . . . . . . .
35 . . . . . . . . . . .
Part A Score
12 . . . . . . . . . . . .
24 . . . . . . . . . . . .
Write your answers to Part B–2 and Part C in your answer booklet.
The declaration below should be signed when you have completed the examination.
I do hereby affirm, at the close of this examination, that I had no unlawful knowledge of the questions or answers prior to
the examination and that I have neither given nor received assistance in answering any of the questions during the examination.
Signature

PS/EARTH SCIENCE
E C N E I C S H T R A E / S P