
PS/EARTH SCIENCE
The University of the State of New York
REGENTS HIGH SCHOOL EXAMINATION
PHYSICAL SETTING
EARTH SCIENCE
Tuesday, August 16, 2005 — 12:30 to 3:30 p.m., only
This is a test of your knowledge of Earth science. Use that knowledge to answer
all questions in this examination. Some questions may require the use of the Earth
Science Reference Tables. The Earth Science Reference Tables are supplied separately.
Be certain you have a copy of the 2001 edition of these reference tables before you
begin the examination.
Your answer sheet for Part A and Part B–1 is the last page of this examination
booklet. Turn to the last page and fold it along the perforations. Then, slowly and
carefully, tear off your answer sheet and fill in the heading.
The answers to the questions in Part B–2 and Part C are to be written in your
separate answer booklet. Be sure to fill in the heading on the front of your answer
booklet.
You are to answer all questions in all parts of this examination according to the
directions provided in the examination booklet. Record your answers to the Part A
and Part B–1 multiple-choice questions on your separate answer sheet. Write your
answers to the Part B–2 and Part C questions in your answer booklet. All work should
be written in pen, except for graphs and drawings, which should be done in pencil.
You may use scrap paper to work out the answers to the questions, but be sure to
record all your answers on your separate answer sheet and in your answer booklet.
When you have completed the examination, you must sign the statement printed
at the end of your separate answer sheet, indicating that you had no unlawful
knowledge of the questions or answers prior to the examination and that you have
neither given nor received assistance in answering any of the questions during the
examination. Your answer sheet and answer booklet cannot be accepted if you fail to
sign this declaration.
Notice. . .
A four-function or scientific calculator and a copy of the 2001 Earth Science Reference Tables
must be available for you to use while taking this examination.
The use of any communications device is strictly prohibited when taking this
examination. If you use any communications device, no matter how briefly, your
examination will be invalidated and no score will be calculated for you.
DO NOT OPEN THIS EXAMINATION BOOKLET UNTIL THE SIGNAL IS GIVEN.
E C N E I C S H T R A E / S P
Part A
Answer all questions in this part.
Directions (1–35): For each statement or question, write on your separate answer sheet the number of the
word or expression that, of those given, best completes the statement or answers the question. Some questions
may require the use of the Earth Science Reference Tables .
1 Compared to Earth’s solar system, the universe is
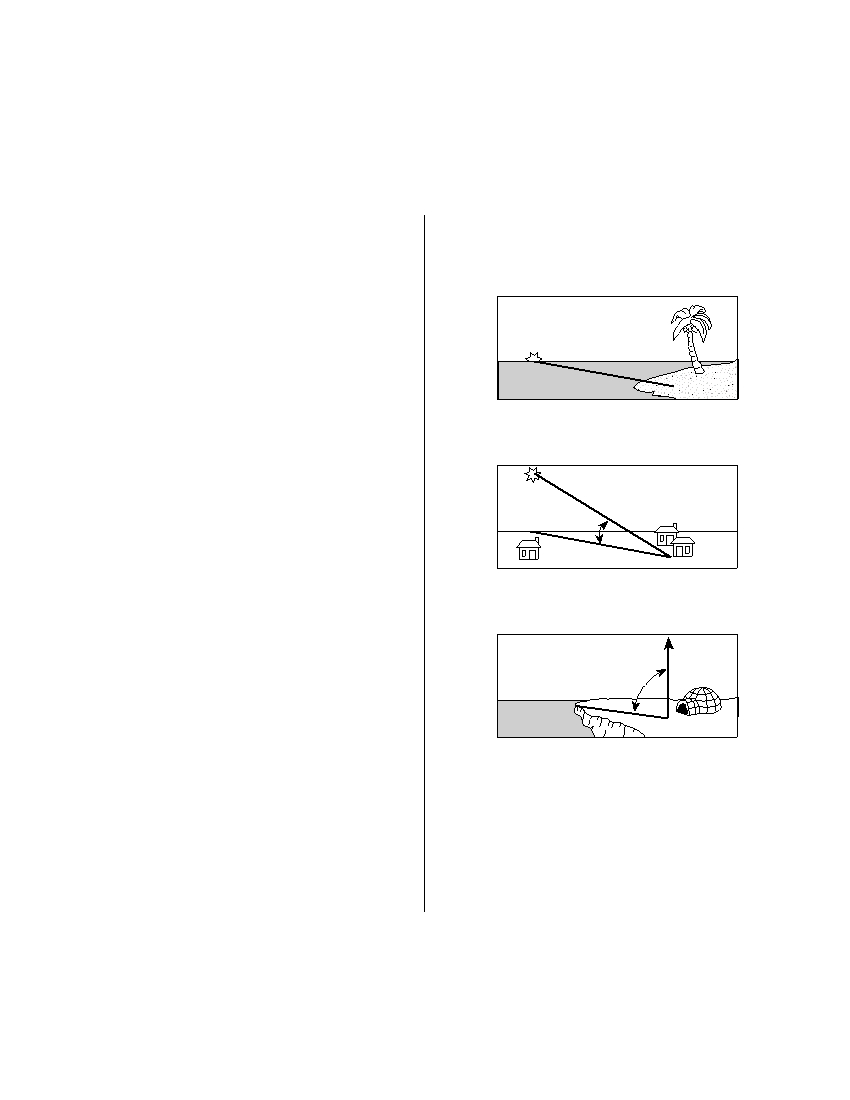
6 Which statement about Polaris is best illustrated
inferred to be
by the diagrams shown below?
(1) younger and larger
(3) older and larger
(2) younger and smaller
(4) older and smaller
At Equator
2 Terrestrial planets move more rapidly in their
Polaris
orbits than the Jovian planets because terrestrial
planets are
(1) rotating on a tilted axis
(2) more dense
(3) more massive
(4) closer to the Sun
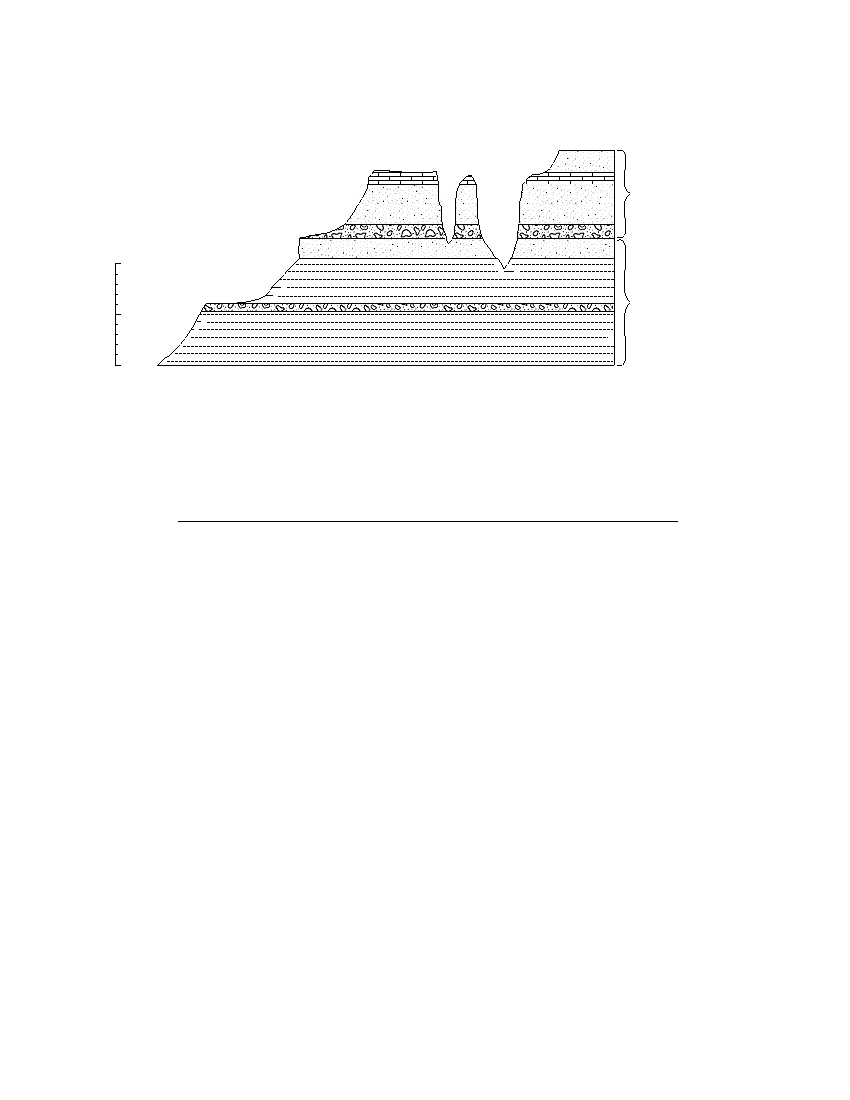
At New Orleans, Louisiana
Polaris
3 Which event is a direct result of Earth’s revolu-
tion?
(1) the apparent deflection of winds
30 °
(2) the changing of the Moon phases
(3) the seasonal changes in constellations viewed
in the night sky
(4) the daily rising and setting of the Sun
At North Pole
4 The cyclic rise and fall of ocean tides on Earth is
To Polaris
primarily caused by Earth’s rotation and the
(1) temperature differences in ocean currents
90 °
(2) revolution of Earth around the Sun
(3) direction of Earth’s planetary winds
(4) gravitational attraction of the Moon and the
Sun
(1) Polaris is located in a winter constellation.
(2) Polaris is located at the zenith at each location.
5 The apparent change in direction of a swinging
(3) Polaris’ apparent movement through the sky
Foucault pendulum is the result of the
follows a south-to-north orientation.
(1) rotation of Earth
(4) Polaris’ altitude is equal to a location’s latitude.
(2) revolution of Earth
(3) tilt of Earth’s axis
(4) shape of Earth’s orbit
P.S./E. Sci.–Aug. ’05
[2]
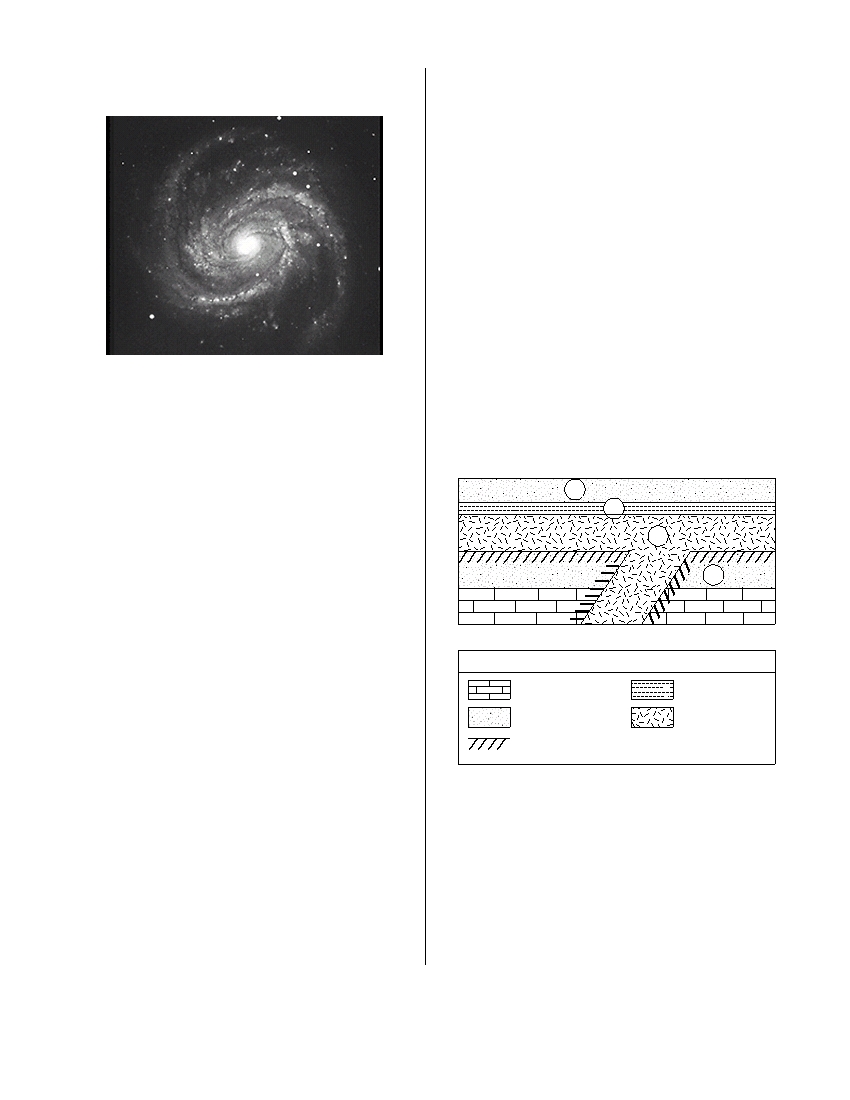
7 The diagram below represents the shape of the
12 A parcel of air has a dry-bulb temperature of
Milky Way Galaxy.
24°C and a relative humidity of 55%. What is the
dewpoint of this parcel of air?
(1) 6°C
(3) 24°C
(2) 14°C
(4) 29°C
13 Which statement can best be supported by the
fossil record?
(1) Humans have lived on Earth throughout geo-
logic history.
(2) The organisms on Earth have not changed.
(3) Most life-forms that existed on Earth have
become extinct.
(4) Dinosaurs existed on Earth for more than
544 million years.
The Milky Way Galaxy is best described as
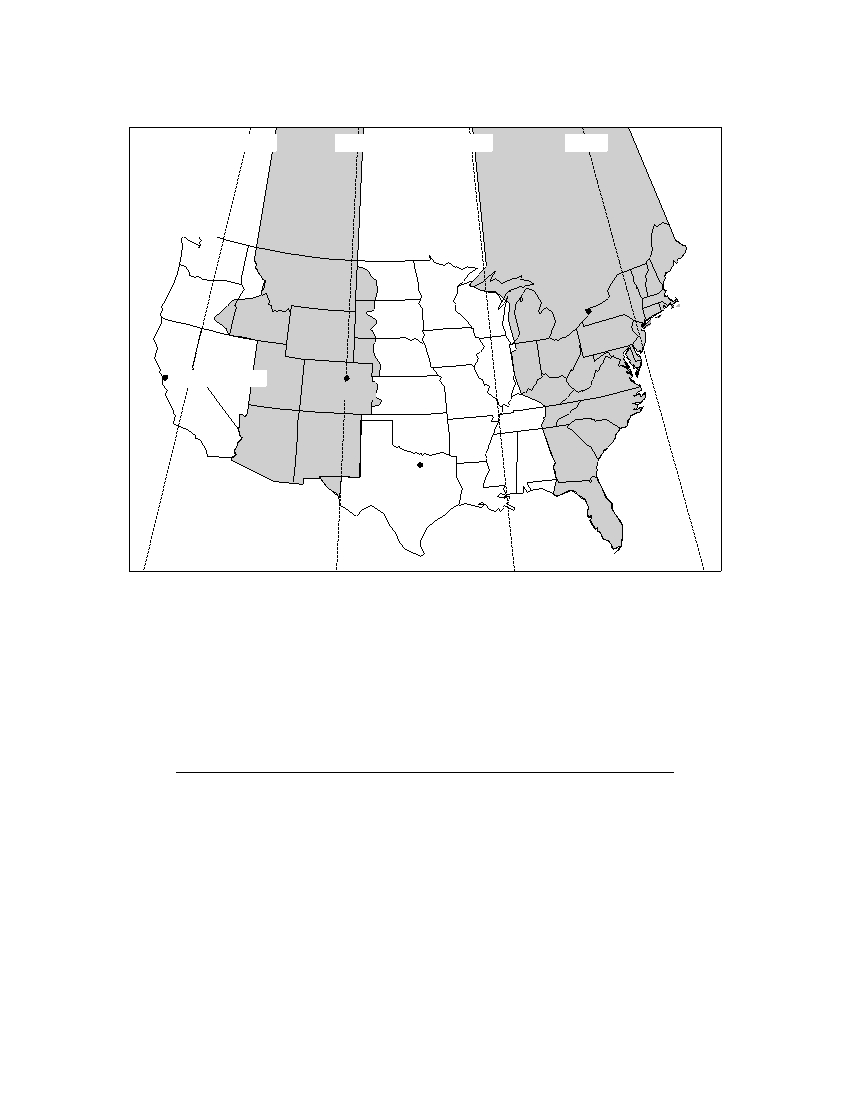
14 The diagram below shows a geologic cross sec-
(1) elliptical
(3) circular
tion. Letters A through D represent different
(2) irregular
(4) spiral
rock units.
8 Compared to the temperature and luminosity of
Surface
the star Polaris , the star Sirius is
A
(1) hotter and more luminous
B
(2) hotter and less luminous
C
(3) cooler and more luminous
(4) cooler and less luminous
D
9 The Big Bang Theory, describing the creation of
the universe, is most directly supported by the
(1) redshift of light from distant galaxies
Key
(2) presence of volcanoes on Earth
(3) apparent shape of star constellations
Limestone
Shale
(4) presence of craters on Earth’s Moon
Sandstone
Igneous rock
Contact metamorphism
10 Which process requires water to gain 540 calories
of energy per gram?
(1) vaporization
(3) melting
Which sequence correctly shows the age of the
(2) condensation
(4) freezing
lettered rock units, from oldest to youngest?
(1) A → B → C → D
11 Which geographic area is a common source region
(2) C → D → A → B
for cP air masses that move into New York State?
(3) D → B → A → C
(4) D → C → B → A
(1) southwestern United States
(2) central Canada
(3) the north Pacific Ocean
(4) the Gulf of Mexico
P.S./E. Sci.–Aug. ’05
[3]
[OVER]
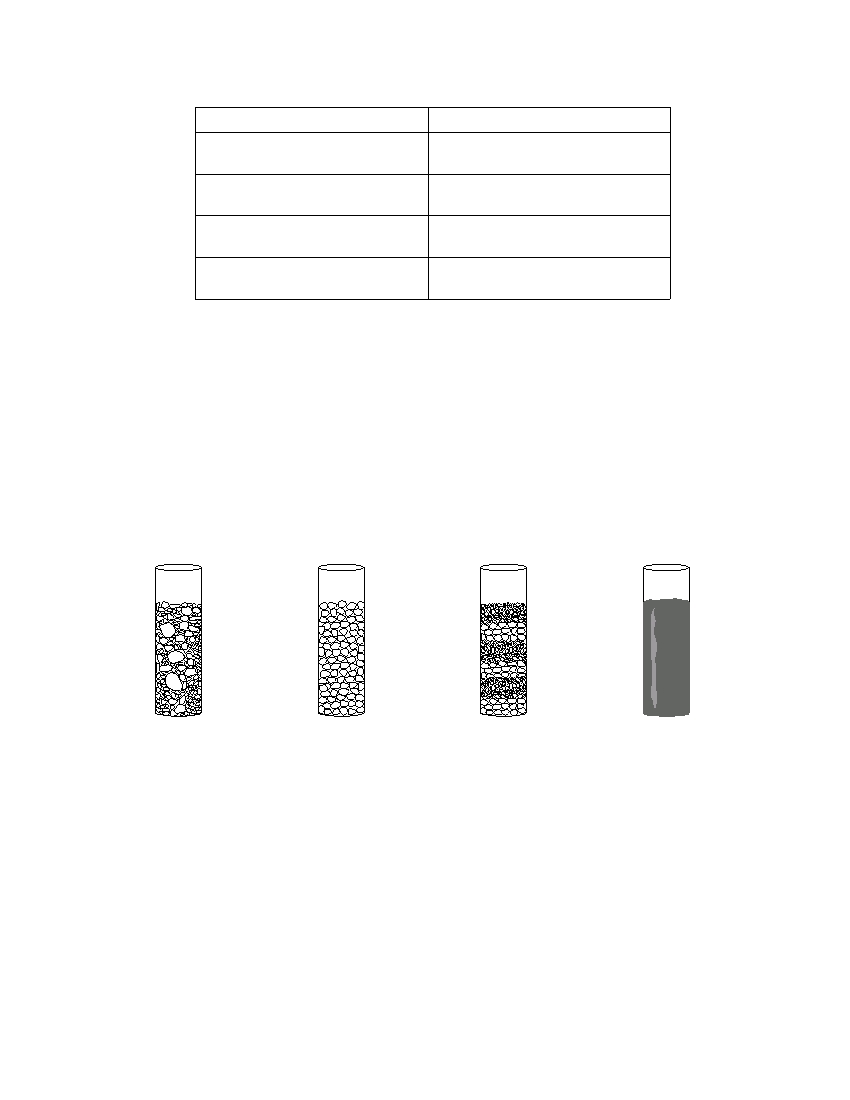
Base your answers to questions 15 and 16 on the United States time zone map shown below. The dashed
lines represent meridians (lines of longitude).
120 ° W
105 ° W
90 ° W
75 ° W
Pacific
Mountain
Central
Eastern
time zone
time zone
time zone
time zone
Buffalo
New York
City
San Francisco
Denver
Dallas
15 If the time in Buffalo, New York, is 5 a.m., what time would it be in San Francisco,
California?
(1) 8 a.m.
(3) 3 a.m.
(2) 2 a.m.
(4) 4 a.m.
16 The basis for the time difference between adjoining time zones is Earth’s
(1) 1° per hour rate of revolution
(3) 15° per hour rate of revolution
(2) 1° per hour rate of rotation
(4) 15° per hour rate of rotation
P.S./E. Sci.–Aug. ’05
[4]
17 The table below shows some observed physical properties of a mineral.
Physical Property
Observation
color
white
hardness
scratched by the mineral calcite
distinguishing characteristic
feels greasy
cleavage/fracture
shows some definite flat surfaces
Based on these observations, the elements that make up this mineral’s composition
are
(1) sulfur and lead
(2) sulfur, oxygen, and hydrogen
(3) oxygen, silicon, hydrogen, and magnesium
(4) oxygen, silicon, aluminum, and iron
18 The columns A , B , C , and D shown below contain equal volumes of sediment.
Column A
Column B
Column C
Column D
Mixed particles
Uniform-sized
Sorted particles
Dry mud
(0.00001 cm to
particles
(0.0001 cm to
(Smaller than
0.5 cm in size)
(0.2 cm)
0.2 cm in size)
0.0004 cm in size)
(Not drawn to scale)
When an equal volume of water is added to each column, the greatest rate of
infiltration will occur in which column?
(1) A
(3) C
(2) B
(4) D
P.S./E. Sci.–Aug. ’05
[5]
[OVER]
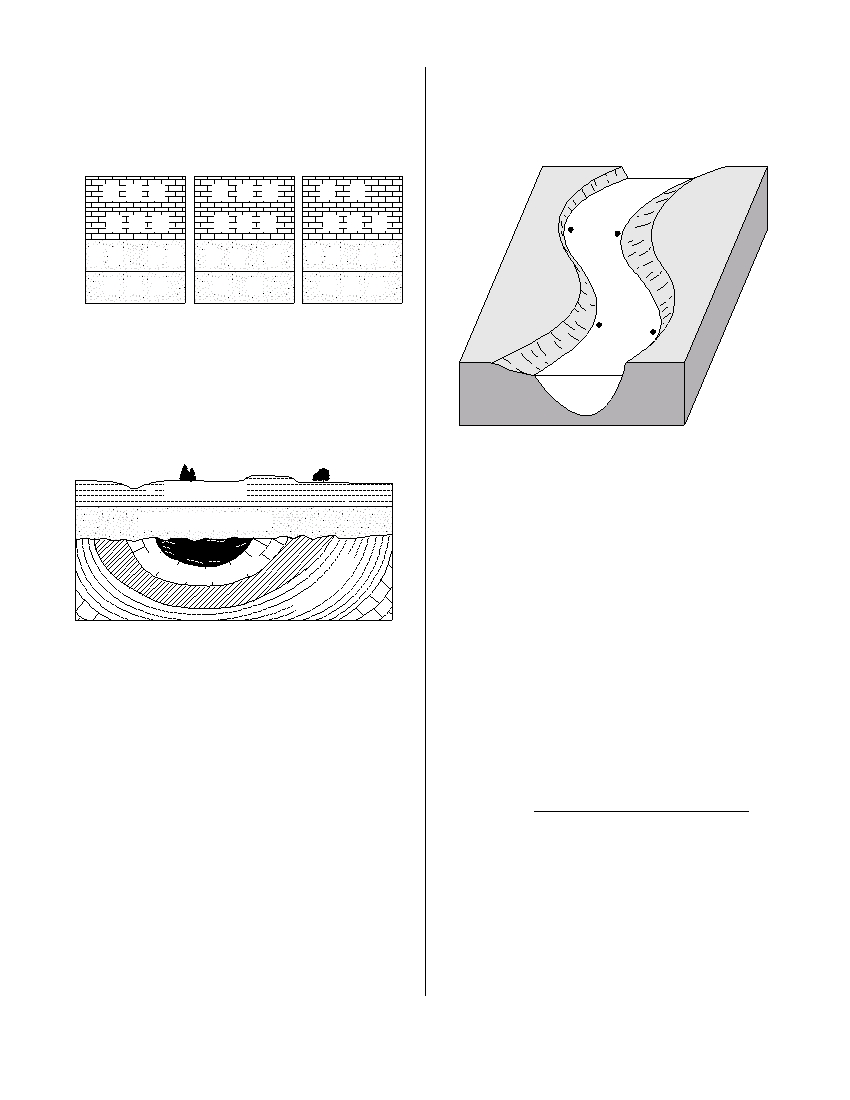
19 The three cross sections of sedimentary bedrock
Base your answers to questions 22 through 24 on
shown below represent widely separated surface
the diagram below, which shows a meandering
exposures of layers that contain fossils. Letters A ,
stream. Letters A , B , C , and D indicate locations on
B , C , and D represent four different marine fos-
the streambed.
sils found in these rock layers.
A A A
D D D
D D
A B A
A A A
A D B
A
B
B B
C C
C B C
C C A C
A B D
A D
A B D
C
D
Which letter best represents an index fossil?
(1) A
(3) C
(2) B
(4) D
20 The diagram below represents a geologic cross
section of a portion of Earth’s crust.
22 At which two locations is the rate of erosion
Surface
Gayle shale
greater than the rate of deposition?
(1) A and B
(3) C and D
Freeport sandstone
(2) B and C
(4) D and A
D
Erie coal
u
n b
l e
a r l i m e s t o
n e
a
23 What are the largest particles that this stream can
N e w
C r e e k g y p s u
m
t s h
transport when its velocity is 200 centimeters per
l l e
B u
second?
(1) silt
(3) pebbles
(2) sand
(4) cobbles
Folding and erosion occurred after the formation
of the
(1) Gayle shale
24 A decrease in the velocity of this stream will most
(2) Freeport sandstone
likely cause an increase in
(3) Erie coal, but before formation of Freeport
(1) the amount of sediment carried by the stream
sandstone
(2) the size of the particles carried by the stream
(4) Dunbar limestone, but before formation of
(3) deposition within the stream channel
Erie coal
(4) abrasion of the stream channel
21 The surface winds in a typical Northern
Hemisphere high-pressure system are generally
25 Beneath which surface location is Earth’s crust
moving
the thinnest?
(1) counterclockwise away from the high-pressure
(1) East Pacific Ridge
center
(2) the center of South America
(2) counterclockwise toward the high-pressure
(3) Old Forge, New York
center
(4) San Andreas Fault
(3) clockwise away from the high-pressure center
(4) clockwise toward the high-pressure center
P.S./E. Sci.–Aug. ’05
[6]
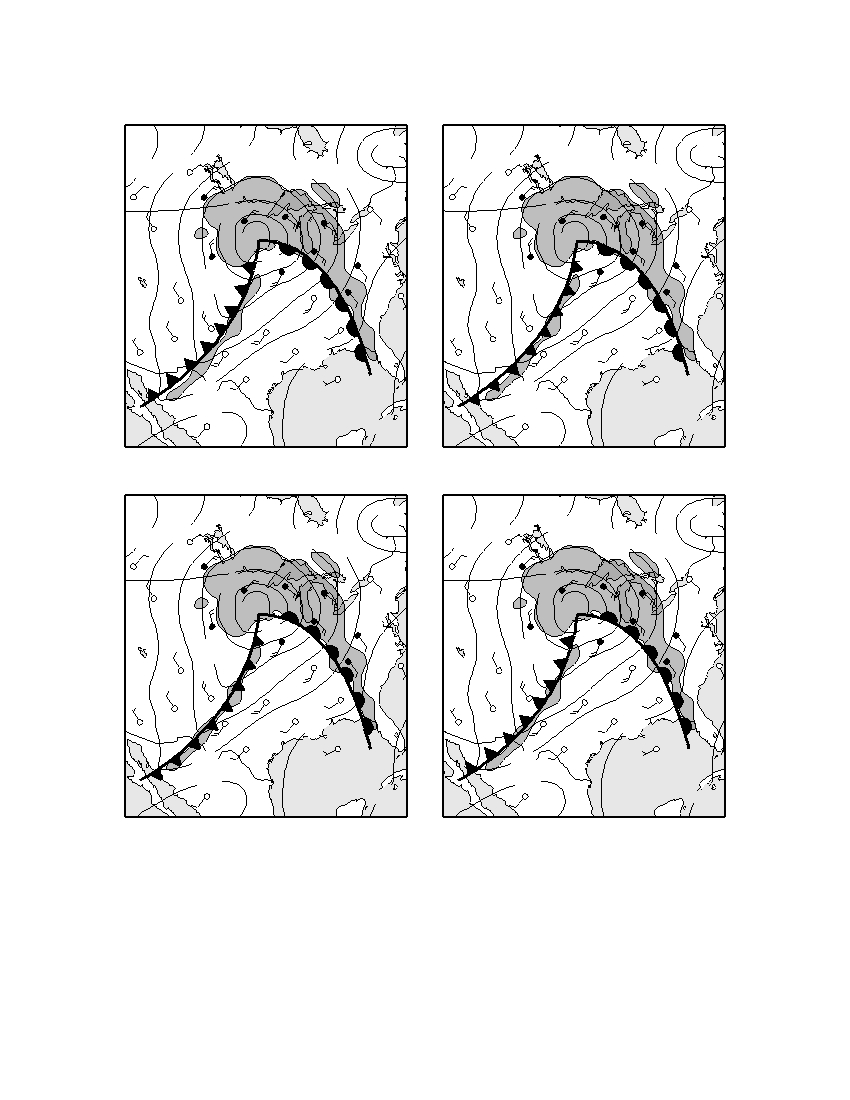
26 On which weather map do the front symbols best represent the direction of movement of the cold front and
warm front associated with the low-pressure system shown on the map?
1020
1020
1008
1008
1012
H
1008
1008
1012
H
1016
1012
1016
1012
1000
1000
992 L
992 L
1004
996
1004
996
1012
1012
1012
1012
1016
1016
1016
1016
( 1 )
( 3 )
1020
1020
1008
1008
1012
H
1008
1008
1012
H
1016
1012
1016
1012
1000
1000
992 L
992 L
1004
996
1004
996
1012
1012
1012
1012
1016
1016
1016
1016
( 2 )
( 4 )
P.S./E. Sci.–Aug. ’05
[7]
[OVER]
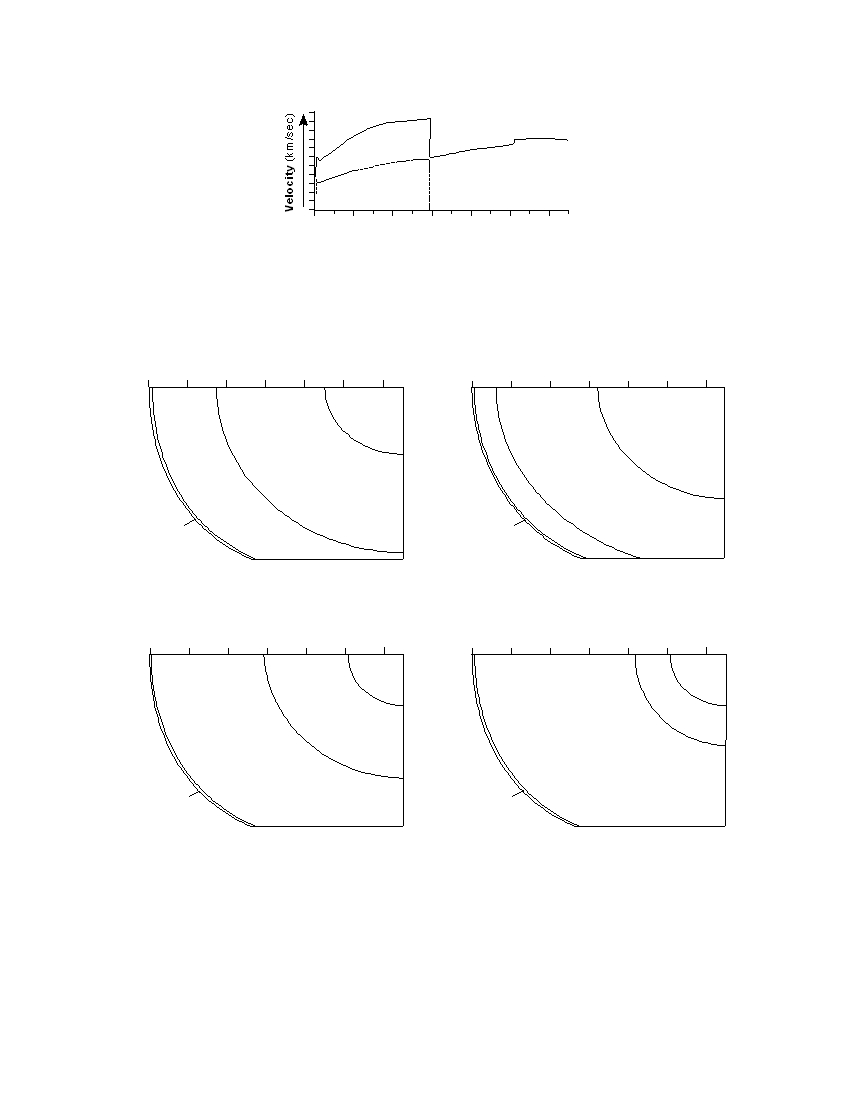
27 The graph below shows the different velocities of P -waves and S -waves through Earth’s interior.
a v e
P - w
S - w a v e
0
1000 2000 3000 4000 5000 6000
Depth (km)
Which cross section best shows the inferred thickness of Earth’s interior layers that
cause these different velocities?
Depth (km)
Depth (km)
0
1000 2000 3000 4000 5000 6000
0
1000 2000 3000 4000 5000 6000
Inner
core
Inner
core
Outer core
Mantle
Outer core
Mantle
Crust
Crust
( 1 )
( 3 )
Depth (km)
Depth (km)
0
1000 2000 3000 4000 5000 6000
0
1000 2000 3000 4000 5000 6000
Inner
Inner
core
O
u
core
t e
r
Outer core
c o
r e
Mantle
Mantle
Crust
Crust
( 2 )
( 4 )
P.S./E. Sci.–Aug. ’05
[8]

28 The diagram below represents the pattern of normal and reversed magnetic polarity and the relative age of
the igneous bedrock composing the ocean floor on the east side of the Mid-Atlantic Ridge. The magnetic
polarity of the bedrock on the west side of the ridge has been deliberately left blank.
Mid-Atlantic Ridge
West
East
Increasing Age
Mantle
Key
Reversed
Normal
polarity
polarity
Which diagram best shows the magnetic pattern and relative age of the igneous
bedrock on the west side of the ridge?
Mid-Atlantic Ridge
Mid-Atlantic Ridge
Mid-Atlantic Ridge
Mid-Atlantic Ridge
West
West
West
West
Increasing Age
Increasing Age
Increasing Age
Increasing Age
( 1 )
( 2 )
( 3 )
( 4 )
P.S./E. Sci.–Aug. ’05
[9]
[OVER]
29 Which conditions normally can be found in
33 An increase in the amount of which atmospheric
Earth’s asthenosphere, producing a partial melt-
gas is thought to cause global climate warming?
ing of ultramafic rock?
(1) oxygen
(3) nitrogen
(1) temperature = 1,000°C;
(2) hydrogen
(4) carbon dioxide
pressure = 10 million atmospheres
(2) temperature = 2,000°C;
pressure = 0.1 million atmospheres
34 The diagram below shows a drill core of sediment
(3) temperature = 3,500°C;
that was taken from the bottom of a lake.
pressure = 0.5 million atmospheres
(4) temperature = 6,000°C;
pressure = 4 million atmospheres
30 Which color of the visible light spectrum could
have a wavelength of 5.5 × 10 –5 centimeter?
Calcite
Sand
deposits
sediments
(1) green
(3) yellow
(2) orange
(4) red
31 Compared to the climate conditions of dry inland
locations, the climate conditions of locations
influenced by a nearby ocean generally result in
(1) hotter summers and colder winters, with a
larger annual range of temperatures
(2) hotter summers and colder winters, with a
Which types of rock would most likely form from
smaller annual range of temperatures
compaction and cementation of these sediments?
(3) cooler summers and warmer winters, with a
(1) sandstone and limestone
larger annual range of temperatures
(2) shale and coal
(4) cooler summers and warmer winters, with a
(3) breccia and rock salt
smaller annual range of temperatures
(4) conglomerate and siltstone
32 Biotite mica and muscovite mica have different
35 Which intrusive igneous rock could be composed
chemical compositions. Compared to the magma
of approximately 60% pyroxene, 25% plagioclase
from which biotite mica forms, the magma from
feldspar, 10% olivine, and 5% amphibole?
which muscovite mica forms is usually
(1) granite
(3) gabbro
(1) more mafic and less dense
(2) rhyolite
(4) basalt
(2) more mafic and more dense
(3) more felsic and less dense
(4) more felsic and more dense
P.S./E. Sci.–Aug. ’05
[10]
Part B–1
Answer all questions in this part.
Directions (36–50): For each statement or question, write on your separate answer sheet the number of the
word or expression that, of those given, best completes the statement or answers the question. Some questions
may require the use of the Earth Science Reference Tables .
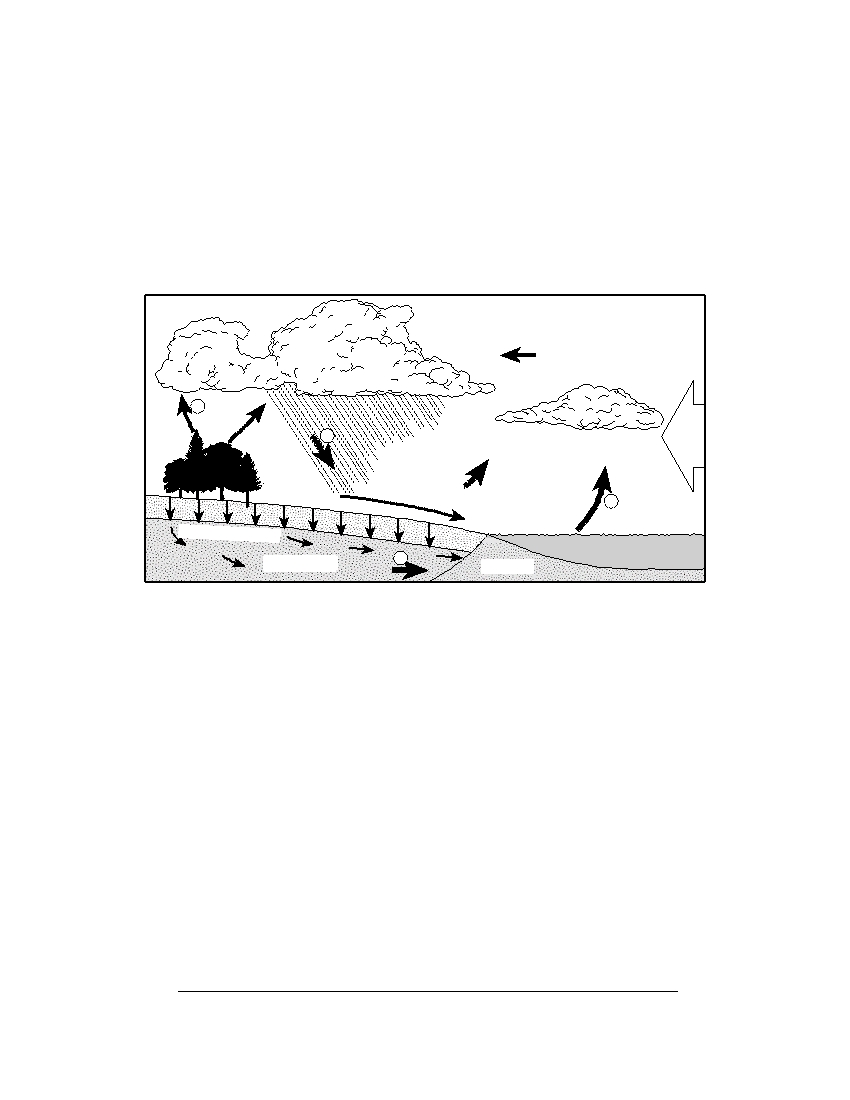
Base your answers to questions 36 through 39 on the water cycle diagram shown below. Some arrows are
numbered 1 through 4 and represent various processes.
Hydrologic Cycle
1
2
Wind
4
Zone of saturation
Sea
Groundwater
3
Saltwater
36 Which numbered arrow best represents the process of transpiration?
(1) 1
(3) 3
(2) 2
(4) 4
37 The clouds have formed primarily because moist air
(1) rises, expands, and cools
(3) sinks, compresses, and cools
(2) rises, expands, and warms
(4) sinks, compresses, and warms
38 For infiltration to occur, the ground must be
(1) permeable and saturated
(3) impermeable and saturated
(2) permeable and not saturated
(4) impermeable and not saturated
39 Which atmospheric condition is most likely responsible for the wind blowing the
clouds from the sea toward the land?
(1) high air temperature over the sea and low air temperature over the land
(2) high air pressure over the sea and low air pressure over the land
(3) low air density over the sea and high air density over the land
(4) low visibility over the sea and high visibility over the land
P.S./E. Sci.–Aug. ’05
[11]
[OVER]
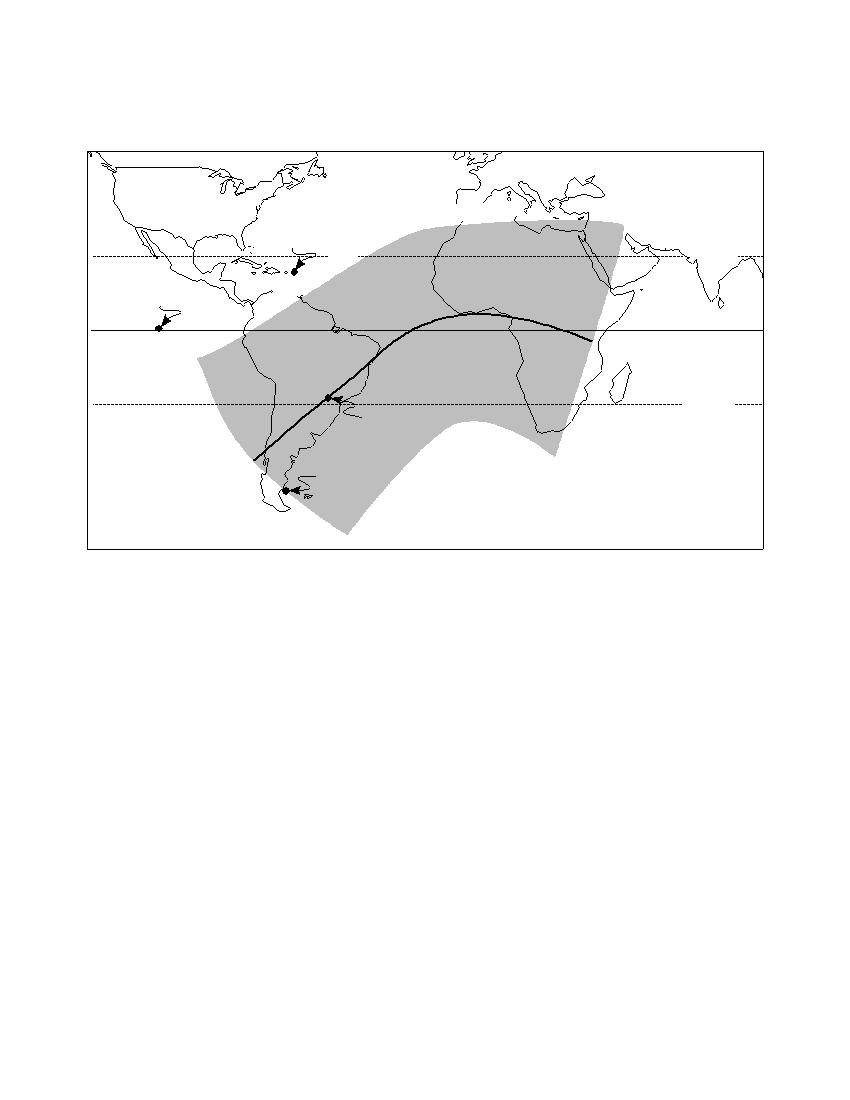
Base your answers to questions 40 through 42 on the world map below, which shows regions of Earth where
a solar eclipse was visible on May 20, 1947. Locations A , B , C , and D are on Earth’s surface.
Solar Eclipse May 20, 1947
United States
Location A
a
r t i a l e c l i p s e v i s i b le
i t
o
f p
23.5 ° N
l i m
r n
Partial
h e
Location B
eclipse
N
o rt
l i p s e
t a
l e
c
0 °
o
f
t o
Partial
P
a
t h
eclipse
23.5 ° S
Location C
a r t i a l e c l i p
i t
o
f p
s e
v i s i b le
Location
l i m
D
h
e
r n
S
o
u
t
40 At which location could an observer have viewed this total solar eclipse if the skies
were clear?
(1) A
(3) C
(2) B
(4) D
41 Which statement best describes the visibility of this eclipse from locations in New
York State?
(1) A total eclipse was visible all day.
(2) A total eclipse was visible only from noon until sunset.
(3) A partial eclipse was visible only from noon until sunset.
(4) Neither a partial nor a total eclipse was visible.
P.S./E. Sci.–Aug. ’05
[12]

42 Which diagram best represents the positions of Earth ( E ), the Sun, and the Moon
( M ) that created the solar eclipse? (Diagrams are not drawn to scale.)
M
M
Sun
E
Sun
E
( 1 )
( 3 )
M
Sun
E
Sun
E
M
( 2 )
( 4 )
P.S./E. Sci.–Aug. ’05
[13]
[OVER]
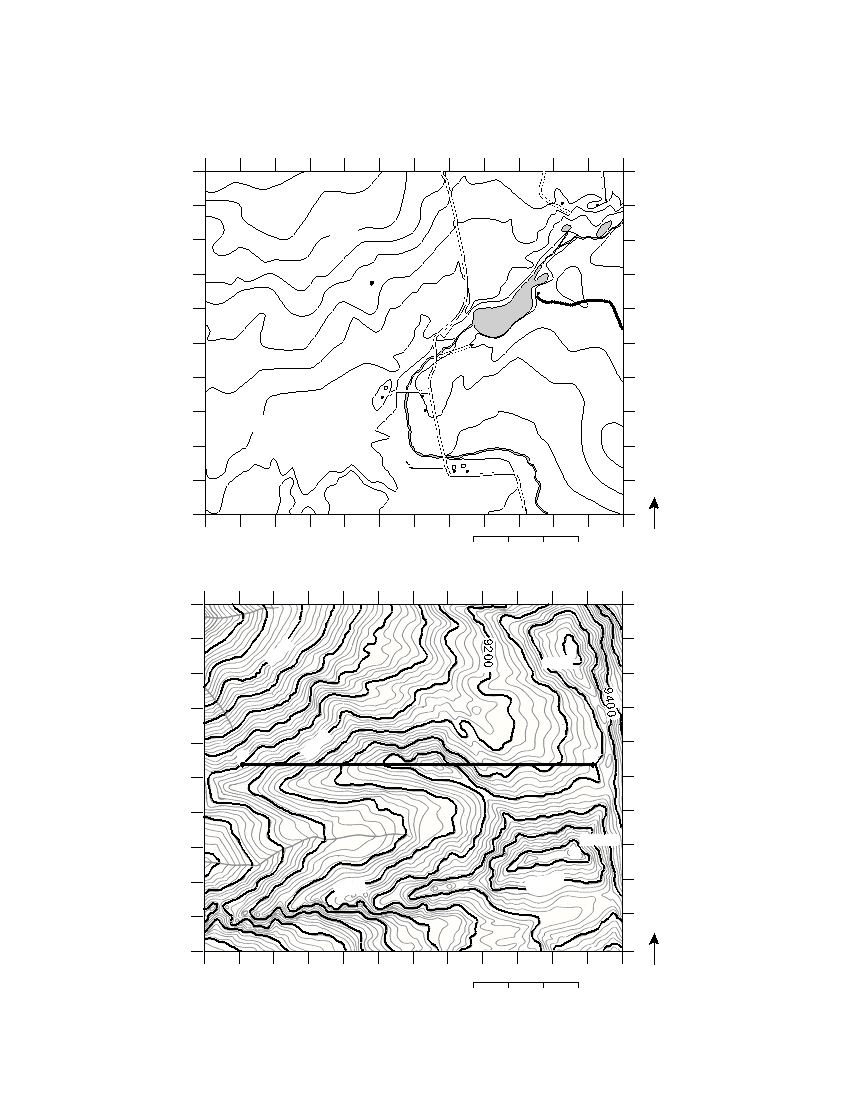
Base your answers to questions 43 through 46 on the two topographic maps below. A grid system of num-
bers and letters appears along the edge of each map to help locate features. Both maps show elevations in feet
above sea level.
Map A
1
2
3
4
5
6
7
8
9
10
11
12
A
A
B
B
100
C
C
W
D
D
E
49
Mill Pond
E
F
F
G
G
H
50
H
M i l l C r e e k
I
I
J
J
N
1
2
3
4
5
6
7
8
9
10
11
12
0
0.1
0.2
0.3 mile
Map B
1
2
3
4
5
6
7
8
9
10
11
12
A
A
B
X
8000
9848
B
C
C
D
D
E
Y
9000
Z
E
F
F
G
G
10292
X
H
H
10000
I
9400
I
J
J
N
1
2
3
4
5
6
7
8
9
10
11
12
0
0.1
0.2
0.3 mile
P.S./E. Sci.–Aug. ’05
[14]
43 Which statement correctly describes one difference between these maps?
(1) Map A has a greater relief (elevation change between high and low locations)
than map B .
(2) Map A represents a much larger surface area than map B .
(3) Map A shows more contour lines than map B .
(4) Map A generally shows gentler slopes than map B .
44 On map B , what is the approximate straight-line distance from the center of the X
within grid area B –11 to the center of the X within grid area H –11?
(1) 0.3 mi
(3) 1.2 mi
(2) 0.6 mi
(4) 1.5 mi
45 Which direction is the stream mainly flowing within grid area H –1 on map B ?
(1) northward
(3) eastward
(2) southward
(4) westward
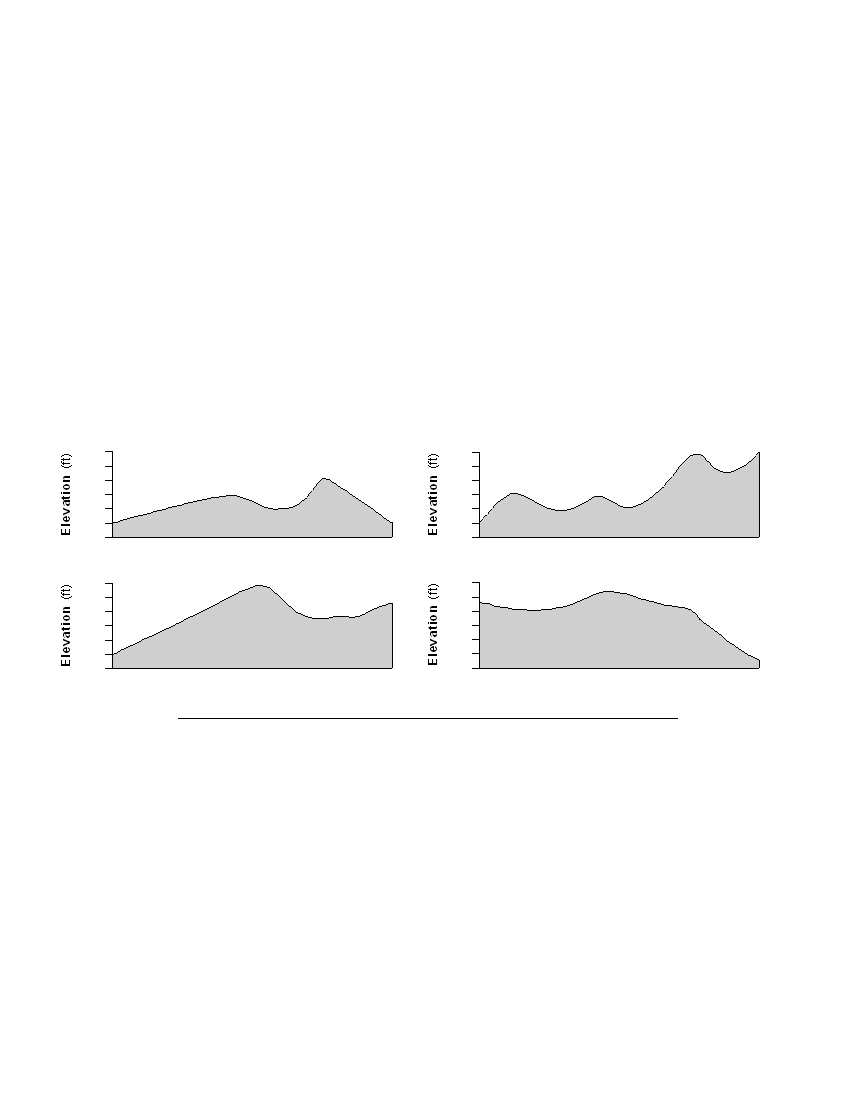
46 Which cross section best represents the topographic profile along the straight line
from point Y to point Z on map B ?
9800
9800
9400
9400
9000
9000
8600
8600
Y
Z
Y
Z
( 1 )
( 3 )
9800
9800
9400
9400
9000
9000
8600
8600
Y
Z
Y
Z
( 2 )
( 4 )
P.S./E. Sci.–Aug. ’05
[15]
[OVER]
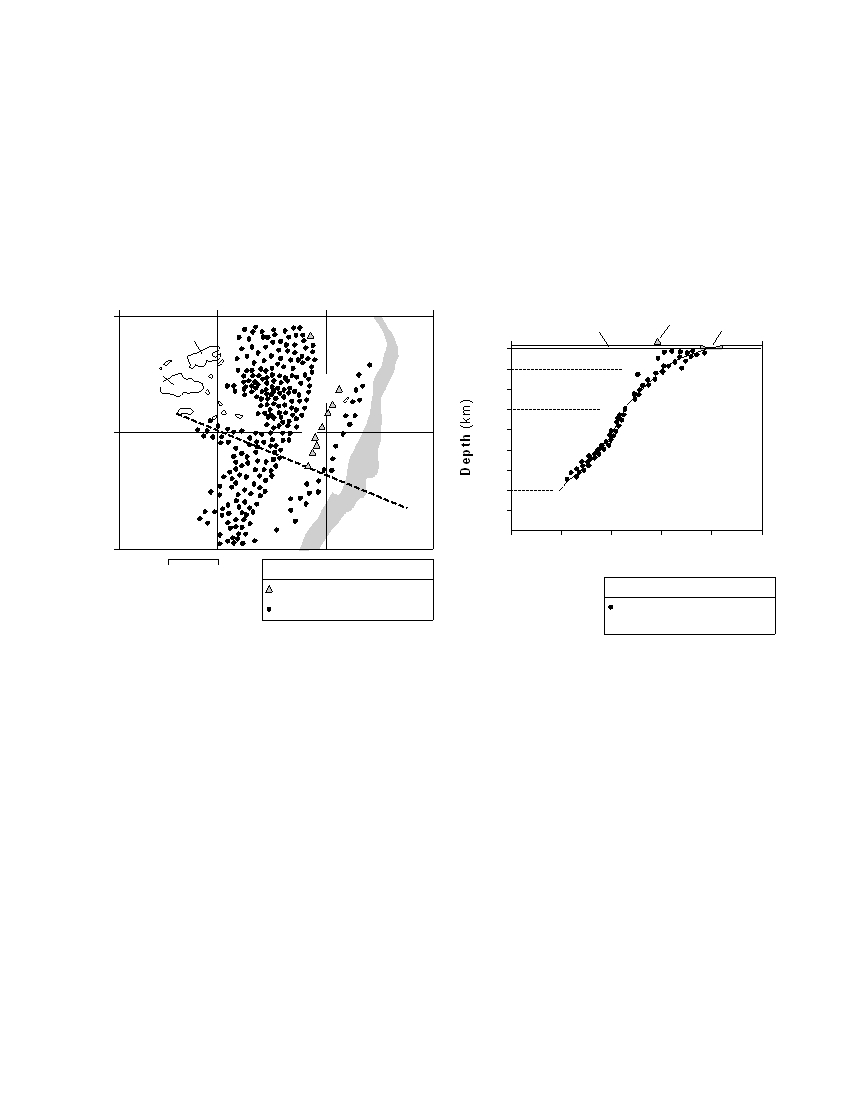
Base your answers to questions 47 through 50 on the information, map, and cross section below.
The map represents a portion of Earth’s surface in the Pacific Ocean. The positions
of islands, earthquake epicenters, active volcanoes, and the Tonga Trench are shown.
Lines of latitude and longitude have been included.
The cross section shows earthquakes that occurred beneath line XY on the map.
Depth beneath Earth’s surface is indicated by the scale along the left side of the cross
section, as are the range of depths for shallow, intermediate, and deep earthquakes.
Distance from the trench is indicated by the scale along the bottom of the cross sec-
tion.
Map
Cross Section
175 ° E
180 °
175 ° W
170 ° W
Crustal
Active
15 ° S
Tonga
Vanau
X Fiji Sea
surface
volcano
Trench
Leva
Y
Pacific Ocean
0
Fiji
Shallow
100
Island
e
n
d
s
200
Intermediate
o n
l a
z
e
n
i o
f f
X
I s
300
400
B
T
o
n
g
a
20 ° S
d
a
t i -
Fiji Sea
Tonga
500
Deep
Trench
600
a
W
700
Y
800
25 ° S
800
600
400
200
0
200
Distance from Trench (km)
0
200 km
Key
Active volcanoes
Key
Earthquake epicenters
Actual depth
earthquake occurred
47 The Tonga Trench is located at the tectonic boundary between the Pacific Plate and
the
(1) Antarctic Plate
(3) Indian-Australian Plate
(2) Philippine Plate
(4) Nazca Plate
48 The greatest number of earthquakes shown in the cross section occurred
(1) at sea level
(2) between sea level and a depth of 100 km
(3) at a depth between 100 and 300 km
(4) at a depth between 300 and 600 km
P.S./E. Sci.–Aug. ’05
[16]
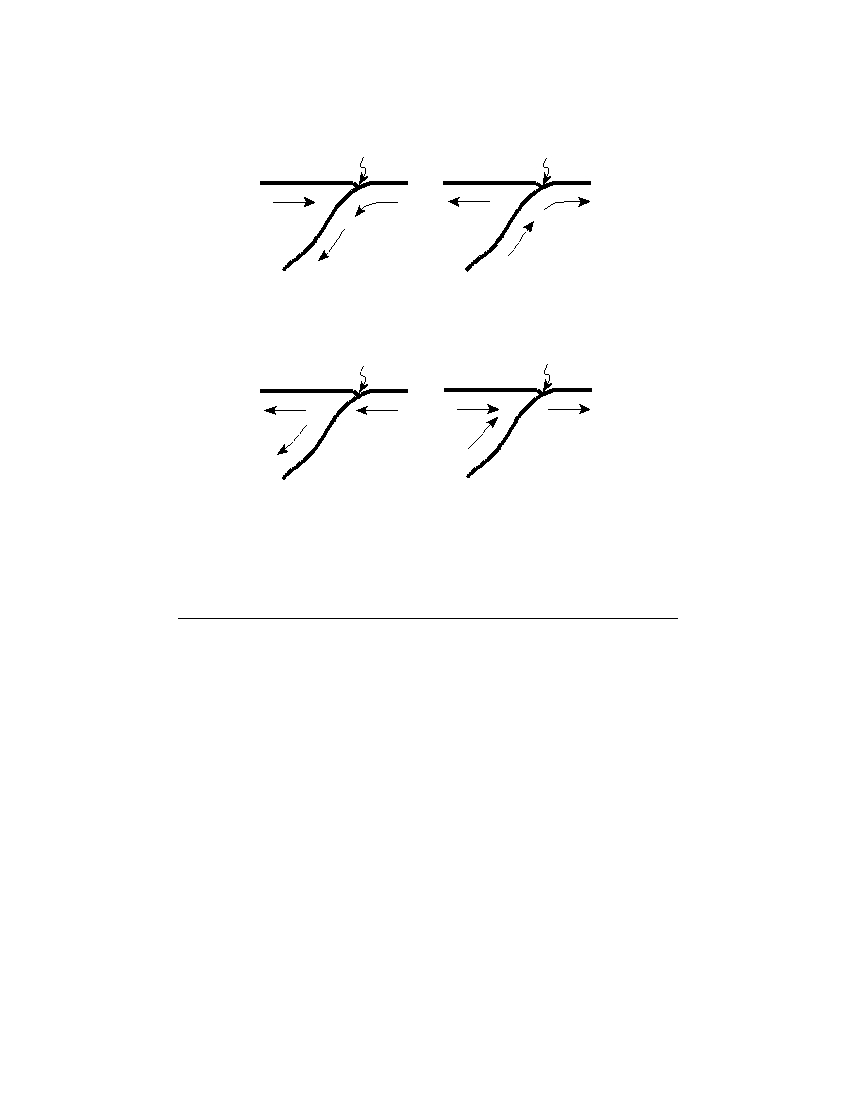
49 Which cross section has arrows that best represent the relative motion of the crustal
plates along the Wadati-Benioff zone beneath the Tonga Trench?
Trench
Trench
X Surface
Y
X Surface
Y
f f
e
n
i o
f f
B
e
n
i o
a
t i
- B
a
t
i -
a d
a d
W
W
( 1 )
( 3 )
Trench
Trench
X Surface
Y
X Surface
Y
f f
e
n
i o
f f
B
e
n
i o
a
t i
- B
a
t
i -
a d
a d
W
W
( 2 )
( 4 )
50 The latitude and longitude of the center of Vanau Leva is closest to
(1) 17° N 179° W
(3) 17° S 179° E
(2) 17° N 181° W
(4) 17° S 181° E
P.S./E. Sci.–Aug. ’05
[17]
[OVER]
Part B–2
Answer all questions in this part.
Directions (51–64): Record your answers in the spaces provided in your answer booklet. Some questions
may require the use of the Earth Science Reference Tables.
Base your answers to questions 51 through 55 on the data table and map below and on your knowledge of
Earth science. The data table shows the altitude of the top of a thunderstorm cloud and the probability of hail
being formed for a location in New York State. The map shows the average number of days per year hail strikes
the ground in different regions of the United States.
Data Table
Altitude of the Top of a
Probability of Hail
Thunderstorm Cloud
Formation
(km)
(%)
13
50
15
75
17
100
MAP
(Average number of days that hail strikes the ground each year)
Key
Days with Hail
0
1
2
4
6
P.S./E. Sci.–Aug. ’05
[18]
51 Describe the relationship between the altitude of the top of a thunderstorm cloud
and the probability that hail will be produced by that cloud. [ 1 ]
52 Into which atmospheric temperature zone (layer) above New York State would the
top of a thunderstorm cloud extend to have a 100% probability of hail? [ 1 ]
53 State the average number of days per year that Syracuse, New York, will experience
hail. [ 1 ]
54 The table below shows weather conditions recorded in Syracuse, New York, at the
time of a severe hailstorm.
Wind direction
from the northwest
Wind speed
20 knots
Visibility
1
4
mile
Present weather
hail
Amount of cloud cover 100%
Barometric pressure
990.0 millibars
On the weather map station model in your answer booklet , use the correct symbols and
proper format to indicate the six weather conditions shown in the table. [ 2 ]
55 State one way that humans could protect themselves from harm if a severe hail
warning is issued for their locality. [ 1 ]
Base your answers to questions 56 through 59 on the geologic time line shown in your answer booklet.
Letters a through g on the time line indicate specific reference points in geologic time.
56 Place an X on the geologic time line in your answer booklet, so that the center of the
X shows the time that the coral index fossil Lichenaria shown below existed on
Earth. [ 1 ]
57 Letter a indicates a specific time during which geologic period? [ 1 ]
58 Identify the mountain building event (orogeny) that was occurring in eastern North
America at the time represented by letter g . [ 1 ]
59 Identify one letter that indicates a time for which there is no rock record in New
York State. [ 1 ]
P.S./E. Sci.–Aug. ’05
[19]
[OVER]
Base your answers to questions 60 and 61 on the geologic cross section shown below and on your knowledge
of Earth science. The cross section shows the surface of a landscape region in the southwestern United States
and indicates the age, type, and thickness of the bedrock.
Jurassic Period
Vertical scale,
in meters
1000
Triassic Period
500
0
60 State one characteristic, other than the horizontal bedrock structure, shown in the
cross section that supports the idea that this region is correctly classified as a plateau
landscape. [ 1 ]
61 Which New York State landscape region has surface bedrock of the same geologic
age as the surface bedrock shown in this cross section? [ 1 ]
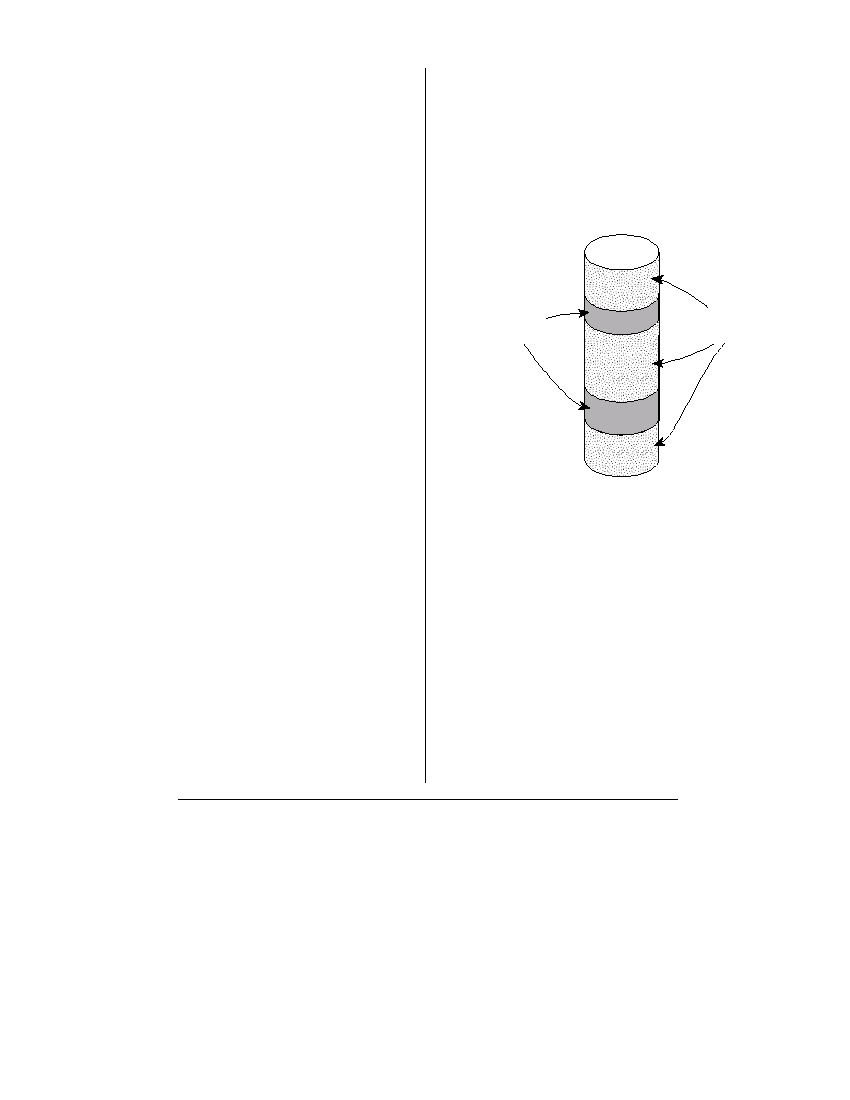
62 The diagram in your answer booklet represents a beaker of water that is being
heated. As the colored dye pellet dissolves, the dye will show the movement of
water in the beaker. On the diagram, draw arrows in the water to show the direc-
tion the colored dye will move when the water is heated as shown. [ 1 ]
P.S./E. Sci.–Aug. ’05
[20]
Base your answers to questions 63 and 64 on the diagram below, which shows two seismogram tracings, at
stations A and B , for the same earthquake. The arrival times of the P -waves and S -waves are indicated on each
tracing.
Seismogram Tracings
Station A
P-wave
S-wave
arrival
arrival
9:00
9:05
9:10
9:15
Time (hr:min)
Station B
P-wave
S-wave
arrival
arrival
9:00
9:05
9:10
9:15
Time (hr:min)
63 Explain how the seismic tracings recorded at station A and station B indicate that
station A is farther from the earthquake epicenter than station B . [ 1 ]
64 Seismic station A is located 5,400 kilometers from the epicenter of the earthquake.
How much time would it take for the first S -wave produced by this earthquake to
reach seismic station A ? [ 1 ]
P.S./E. Sci.–Aug. ’05
[21]
[OVER]

Part C
Answer all questions in this part.
Directions (65–82): Record your answers in the spaces in your answer booklet. Some questions may require
the use of the Earth Science Reference Tables.
65 The diagram in your answer booklet shows the average distance between the Sun
and Earth drawn to a scale of 1 centimeter = 100,000,000 kilometers. Using this
same scale, place a small dot representing Jupiter along the line to indicate how far
Jupiter would be from the Sun, and label the dot “Jupiter.” [ 1 ]
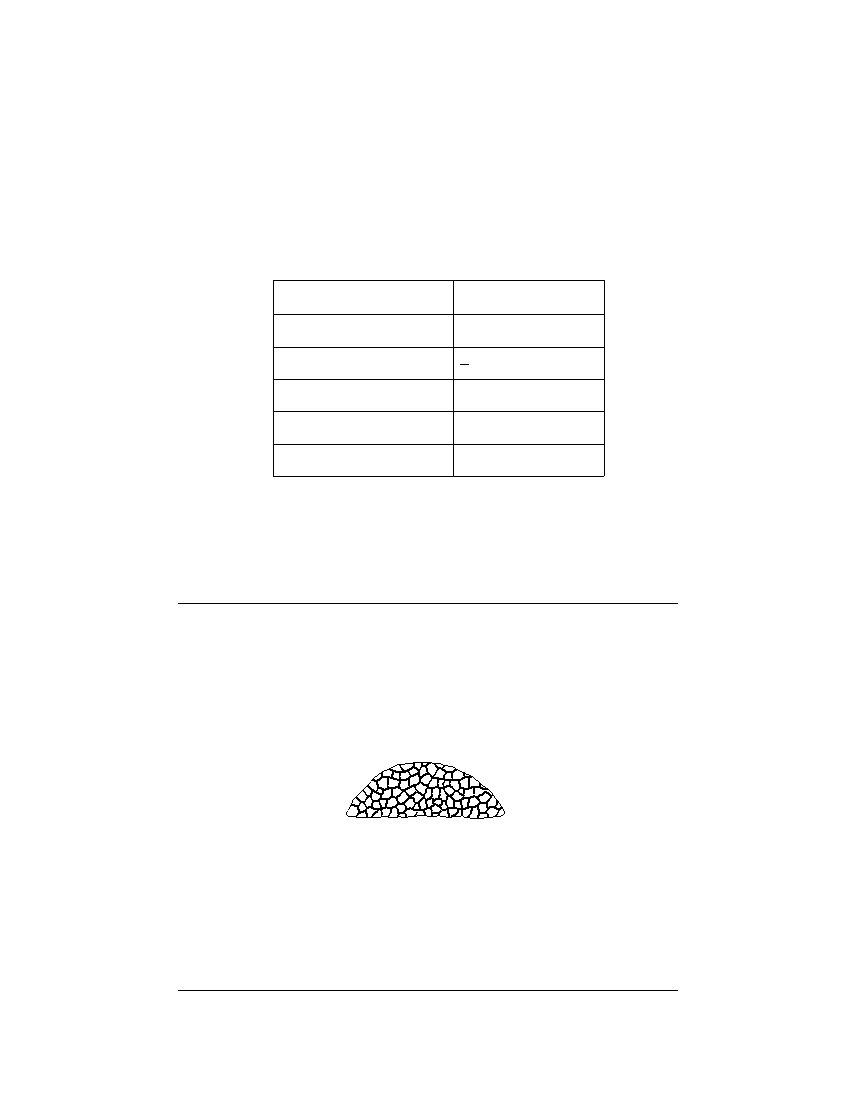
Base your answers to questions 66 and 67 on the diagram and information below about fossil snails and on
your knowledge of Earth science.
Fossil Snail
Top view
clockwise spiral
Snails have lived in most of the world’s oceans over a period of hundreds of millions
of years. Paleontologists discovered that in warm, tropical waters more snails have
shells that, when viewed from the top, spiral outward in a clockwise direction. In cool
or cold waters, more snails have shells that spiral outward in a counterclockwise direc-
tion. Both clockwise- and counterclockwise-spiraled snail fossils have been found in
New York State bedrock.
66 In a slab of rock that contains many fossil snails, what evidence would lead geologists
to conclude that the slab was formed in a tropical climate? [ 1 ]
67 State one reason bedrock that formed in tropical regions is found in New York State. [ 1 ]
P.S./E. Sci.–Aug. ’05
[22]

Base your answers to questions 68 through 70 on the data table below, which shows the average date of the
first breakup of ice on the Tanana River at Nenana, Alaska (65° N 149° W). The average date of the first ice
breakup is shown for four decades.
Data Table
Decade
Average Date of
First Ice Breakup
1960–1969
May 7
1970–1979
May 5
1980–1989
May 4
1990–1999
April 29
68 On the grid in your answer booklet , construct a bar graph of the average date of the
first ice breakup for each decade shown on the data table. [ 1 ]
69 State one possible climate change responsible for the difference in the average dates
of the first ice breakups shown by the data table. [ 1 ]
70 Explain why the number of daylight hours on May 5 for an observer located at
Nenana, Alaska, will be different than the number of daylight hours for an observer
located at New York, New York (41° N 73° 45' W). [ 1 ]
71 Complete the table in your answer booklet , by listing three agents of erosion and
identifying one characteristic surface feature formed by each agent of erosion. [ 2 ]
Base your answers to questions 72 and 73 on the diagram in your answer booklet , which represents an
asteroid’s elliptical orbit around the Sun. The dashed line is the major axis of the ellipse.
72 Place a circle, O , on the orbital path where the velocity of the asteroid would be the
least. [ 1 ]
73 The Sun is located at one focal point of the orbit. Place an X on the diagram at the
location of the second focal point. [ 1 ]
P.S./E. Sci.–Aug. ’05
[23]
[OVER]
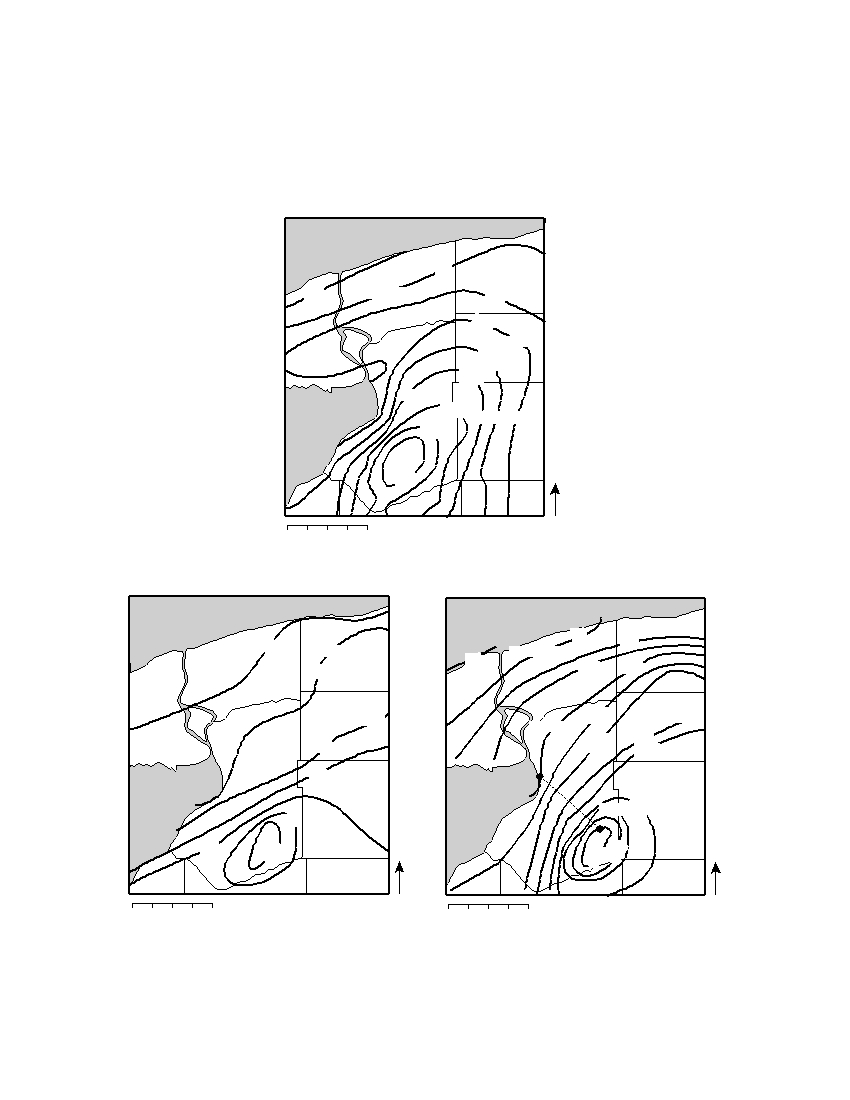
Base your answers to questions 74 through 77 on the three western New York State snowfall maps below
and on your knowledge of Earth science. The three maps represent three different winter seasons. The isolines
show the total inches of snowfall received each winter season. Some western New York State counties are
labeled on each map. The dotted line AB has been drawn on the 1991–1992 winter season map.
Total Inches of Snowfall Received
1985–1986 Winter Season
Lake Ontario
80
Orleans County
70
Niagara County
90
100
Genesee County
Ontario
11
120
0
Erie County
130
Lake Erie
Wyoming County
140
150
N
0
5 10 15 20 miles
1990–1991 Winter Season
1991–1992 Winter Season
Lake Ontario
Lake Ontario
Orleans County
50
60
Niagara County
40
Orleans County
Niagara County
40
50
70
80
Ontario
Ontario
Genesee County
Genesee County
Erie County
90
11
0
Erie County
60
100
120
70
A
130
Wyoming County
Lake Erie
Wyoming County
Lake Erie
90
140
B
80
100
N
160
150
N
0
5 10 15 20 miles
0
5 10 15 20 miles
P.S./E. Sci.–Aug. ’05
[24]

74 Calculate the average snowfall gradient along the dotted line between points A and
B on the 1991–1992 winter season map, and label your answer with the correct
units. [ 2 ]
75 Once the surface of Lake Erie completely freezes over with ice, the amount of snow
from each snowstorm is usually reduced. Explain why a covering of ice on Lake Erie
may cause the amount of snow from snowstorms to be reduced. [ 1 ]
76 On the grid in your answer booklet , draw a line graph to show the general relation-
ship between the amount of snowfall recorded in northern Erie County with the
amount of snowfall recorded in southern Erie County, as shown on the three snow-
fall maps. [ 1 ]
77 On the map in your answer booklet that shows the total inches of snowfall received
at various locations for the 1984–1985 winter season, draw the 120-inch snowfall
isoline. [ 1 ]
Base your answers to questions 78 and 79 on the passage below and on your knowledge of Earth science.
Radiocarbon Dating
Radioactive carbon-14 (C 14 ), because of its short half-life, is used for the absolute
dating of organic remains that are less than 70,000 years old.
Carbon-14 is an isotope of carbon that is produced in Earth’s upper atmosphere.
High-energy cosmic rays from the Sun hit nitrogen-14 (N 14 ), producing radioactive
C 14 . This C 14 is unstable and will eventually change back into N 14 through the process
of radioactive decay. The proportions of C 14 and ordinary C 12 in Earth’s atmosphere
remain approximately constant.
Radioactive C 14 , just like ordinary C 12 , can combine with oxygen to make carbon
dioxide. Plants use CO 2 during photosynthesis. The proportion of C 14 to C 12 in the cells
and tissues of living plants is the same as the proportion of C 14 to C 12 in the
atmosphere. After plants die, no new C 14 is taken in because there is no more
photosynthesis. Meanwhile, the C 14 in the dead plant keeps changing back to N 14 , so
there is less and less C 14 . The longer the plant has been dead, the less C 14 is found in
the plant. The age of organic remains can be found by comparing how much C 14 is still
in the organic remains to how much C 14 is in a living organism.
78 Radioactive C 14 was used to determine the geologic age of old wood preserved in a
glacier. The amount of C 14 in the old wood is half the normal amount of C 14 currently
found in the wood of living trees. What is the geologic age of the old wood? [ 1 ]
79 State one difference between dating with the radioactive isotope C 14 and dating with
the radioactive isotope uranium-238 (U 238 ). [ 1 ]
P.S./E. Sci.–Aug. ’05
[25]
[OVER]

Base your answers to questions 80 through 82 on the passage below and on your knowledge of Earth
science.
Great Balls of Fire
The Earth’s predicted near-miss with asteroid XF11 in the year 2028 has once again
focused attention on the fear that a large asteroid or comet hitting our planet could
trigger a global catastrophe.
To back this up, every article and television program about XF11 boldly asserted
that the dinosaur extinction was caused by a giant asteroid impacting into the Earth
65 million years ago. This has typically been accompanied by a picture of frightened
dinosaurs looking skyward at a huge flaming meteorite streaking across the horizon.
This scenario is so widely accepted that few commentators bother to question it any
more. There is, however, much evidence to suggest that an asteroid may not have hit
the Earth 65 million years ago and that, even if it did, it did not cause the mass extinc-
tion of life attributed to it. There is also the possibility that dinosaurs may not have
been around to witness it!
by Paul Chambers
http://www.forteantimes.com/articles/111_asteroid.shtml (6/98)
80 If an asteroid struck Earth 65 million years ago, what surface feature was most
likely created by this asteroid impact? [ 1 ]
81 Identify one geologic process occurring on Earth that could have hidden or even
destroyed this inferred impact feature. [ 1 ]
82 Explain how an asteroid impact may have been able to cause a worldwide mass
extinction of dinosaurs. [ 1 ]
P.S./E. Sci.–Aug. ’05
[26]
The University of the State of New York
R EGENTS H IGH S CHOOL E XAMINATION
PHYSICAL SETTING
EARTH SCIENCE
Tuesday, August 16, 2005 — 12:30 to 3:30 p.m., only
ANSWER SHEET
Student . . . . . . . . . . . . . . . . . . . . . . . . . . . . . . . . . . . . . . . . . . . . .
Sex:
■ Male ■ Female
Grade . . . . . . . . . . . .
Teacher . . . . . . . . . . . . . . . . . . . . . . . . . . . . . . . . . . . . . . . . . . . . .
School
. . . . . . . . . . . . . . . . . . . . . . . . . . . . . . . . . .
Record your answers to Part A and Part B–1 on this answer sheet.
Part A
Part B–1
1 . . . . . . . . . . .
13 . . . . . . . . . . .
25 . . . . . . . . . . .
36 . . . . . . . . . . .
44 . . . . . . . . . . .
2 . . . . . . . . . . .
14 . . . . . . . . . . .
26 . . . . . . . . . . .
37 . . . . . . . . . . .
45 . . . . . . . . . . .
3 . . . . . . . . . . .
15 . . . . . . . . . . .
27 . . . . . . . . . . .
38 . . . . . . . . . . .
46 . . . . . . . . . . .
4 . . . . . . . . . . .
16 . . . . . . . . . . .
28 . . . . . . . . . . .
39 . . . . . . . . . . .
47 . . . . . . . . . . .
5 . . . . . . . . . . .
17 . . . . . . . . . . .
29 . . . . . . . . . . .
40 . . . . . . . . . . .
48 . . . . . . . . . . .
6 . . . . . . . . . . .
18 . . . . . . . . . . .
30 . . . . . . . . . . .
41 . . . . . . . . . . .
49 . . . . . . . . . . .
7 . . . . . . . . . . .
19 . . . . . . . . . . .
31 . . . . . . . . . . .
42 . . . . . . . . . . .
50 . . . . . . . . . . .
Part B–1 Score
8 . . . . . . . . . . .
20 . . . . . . . . . . .
32 . . . . . . . . . . .
43 . . . . . . . . . . .
9 . . . . . . . . . . .
21 . . . . . . . . . . .
33 . . . . . . . . . . .
10 . . . . . . . . . . .
22 . . . . . . . . . . .
34 . . . . . . . . . . .
11 . . . . . . . . . . .
23 . . . . . . . . . . .
35 . . . . . . . . . . .
Part A Score
12 . . . . . . . . . . .
24 . . . . . . . . . . .
Write your answers to Part B–2 and Part C in your answer booklet.
The declaration below should be signed when you have completed the examination.
I do hereby affirm, at the close of this examination, that I had no unlawful knowledge of the questions or answers prior to
the examination and that I have neither given nor received assistance in answering any of the questions during the examination.
Signature

PS/EARTH SCIENCE
E C N E I C S H T R A E / S P